|
|
SECTION 2 - COMPENSATION PROGRAM OVERVIEW
|
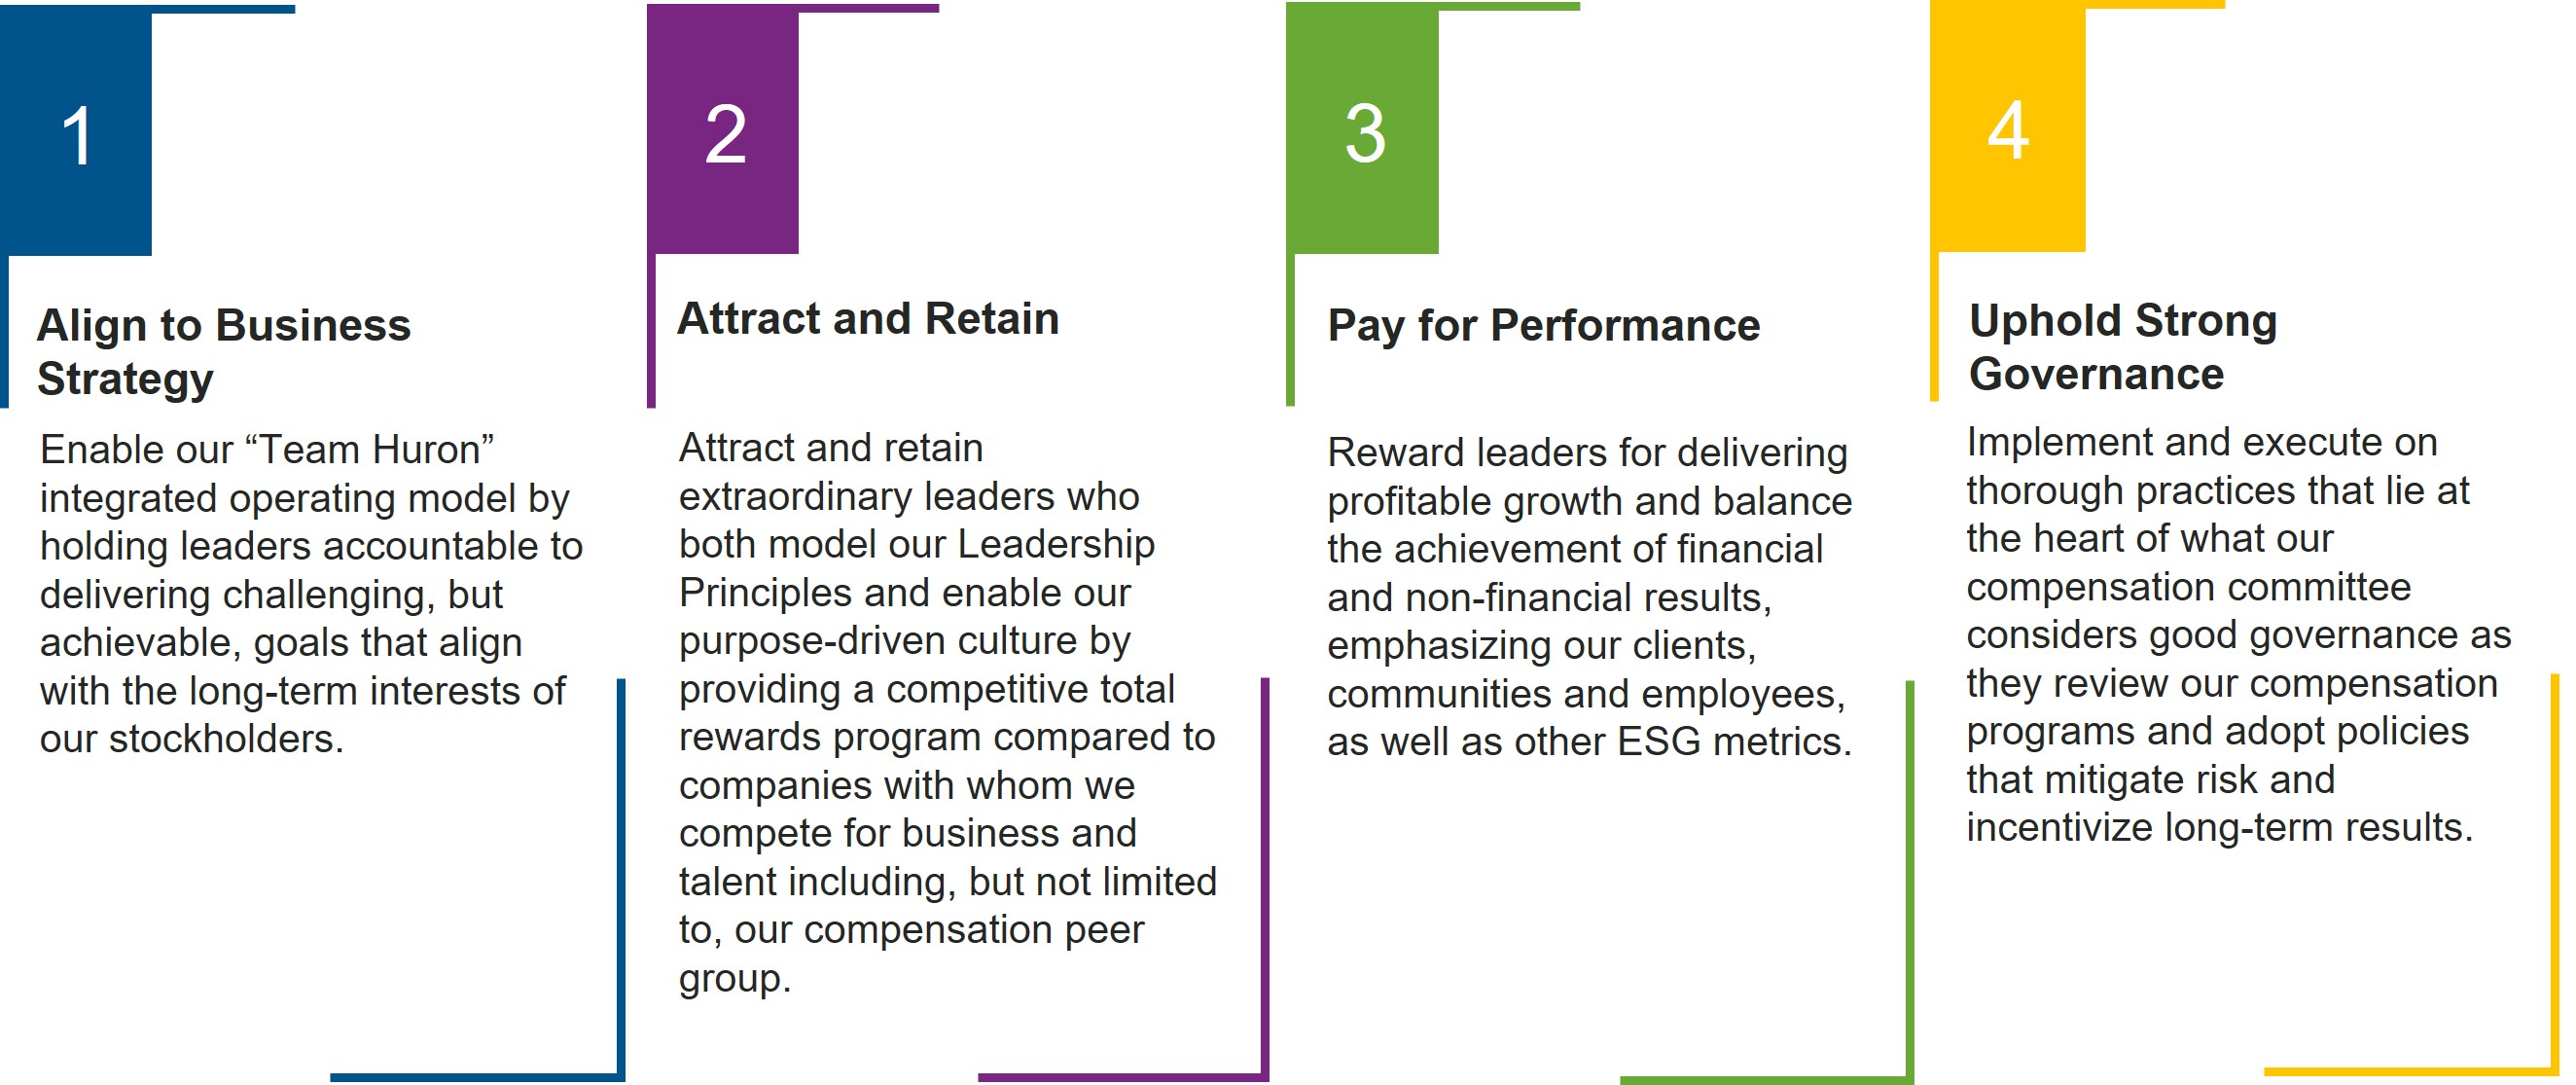
Huron’s executive compensation program is structured to align executive pay with Company performance. We strive to provide compensation to motivate and reward performance that is in the long-term best interests of our shareholders. We define performance as a blend of:
Deliveringof delivering value to shareholders;
Achievingstockholders, achieving financial performance in comparison to pre-established financial goals;goals, and
Attaining establishing and executing strategic initiatives that we believe are responsive to changingevolving market and economic conditions and critical to future stockholder value creation.
The Compensation Committee regularly reviews the design and administration of Huron’s executive compensation program to ensure the pay programs adhere to this philosophy.COMPENSATION BEST PRACTICES | | | | | | | | | | | |
| | What We Do | | | | What We Do Not Do |
✓ü | | Provide competitive targetAlign pay opportunity -with performance with a significant majority of compensation at-risk and based on objective financial performance measures
| û | û | | ProvideNo excise tax gross-ups
|
✓ü | Appropriately balance short-term and long-term incentives | Provide only double-trigger benefits in a change of control event
û | | û | | Allow anyNo hedging or pledging of Huron stock
|
✓ü | Align executive compensation with stockholder returns through performance-based equity grants that include minimum time- vesting requirements | Annually review our programs for inappropriate risk
û | | û | | AllowNo stock grants to be “timed”are "timed" or awards to be repriced
|
✓ü | Establish rigorous, achievable, and predominantly quantitative goals, that ensure focus, measurable progress and overall organizational advancement | Maintain robust, competitive stock ownership guidelines, including an increase as of 2019 to 5X for the CEO and directors, and a requirement that 60% of after-tax shares be held until the guidelines are met
û | | û | | ProvideNo material executive perquisites not commonly available to the broader Huron employee population
or to similarly situated key management employees |
✓ü | Require the annual incentive program funding to be capped at target payout if total shareholder return for the year is negative | û | No "evergreen" features or liberal share counting provisions within our equity plan |
| ü | Perform an annual risk assessment of our compensation programs | û | No automatic grants to any participant within the equity plan |
| ü | Maintain robust stock ownership guidelines | | |
| | | | | | | | | | | |
| ü | Provide only double-trigger benefits in a change of control event | | |
| ü | Maintain a clawback policy providing for recoupment of incentive-based compensation if payouts were based on misstated financial results | | | | |
✓ü | | Retain an independent compensation consultant to the board | | | | |
✓ü | Administer the equity plans through the Compensation Committee, which is comprised entirely of independent directors | | |
| ü | Mitigate potential dilution of equity award grants through our share repurchase program | | |
| ü | Solicit investor feedbackon our compensation program and potential enhancements through an extensive shareholderstockholder engagement program | | |
EXECUTIVE COMPENSATION PAY COMPONENTS
Our incentive plan design strives to execute on our market-competitive compensation philosophy through a meaningful mix of three principal components: (i) base salary, (ii) annual incentives and (iii) long-term incentives.
| | | | | | | | | | | |
| Compensation Element | Form | Compensation Philosophy Alignment | What it Rewards |
| Base Salary | 100% Cash | Provide market competitive base pay that reflects role and responsibilities, ability to effect Company results, executive's experience and individual performance. | Accomplishment of day-to-day responsibilities, individual performance and the executive's experience and the competitiveness of the talent market. |
| Annual Incentive | 100% Cash | Set challenging, but attainable, goals that motivate exceptional performance against the annual operating plan and serves as key compensation vehicle for differentiating performance each year. | Achievement of predefined financial, operational and strategic measures that are commensurate with performance against the annual operating plan. |
| Long-Term Incentive | 70% PSUs | Focus executives on the achievement of strong performance against long-term strategic and financial goals to directly align executive's interests with the long-term interests of stockholders. | Alignment of stockholder interests with the attainment of long-term financial goals and share price appreciation. |
| 30% RSUs | Provide for long-term executive retention. |
Shareholder
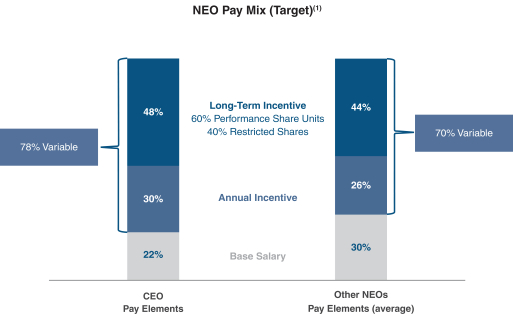
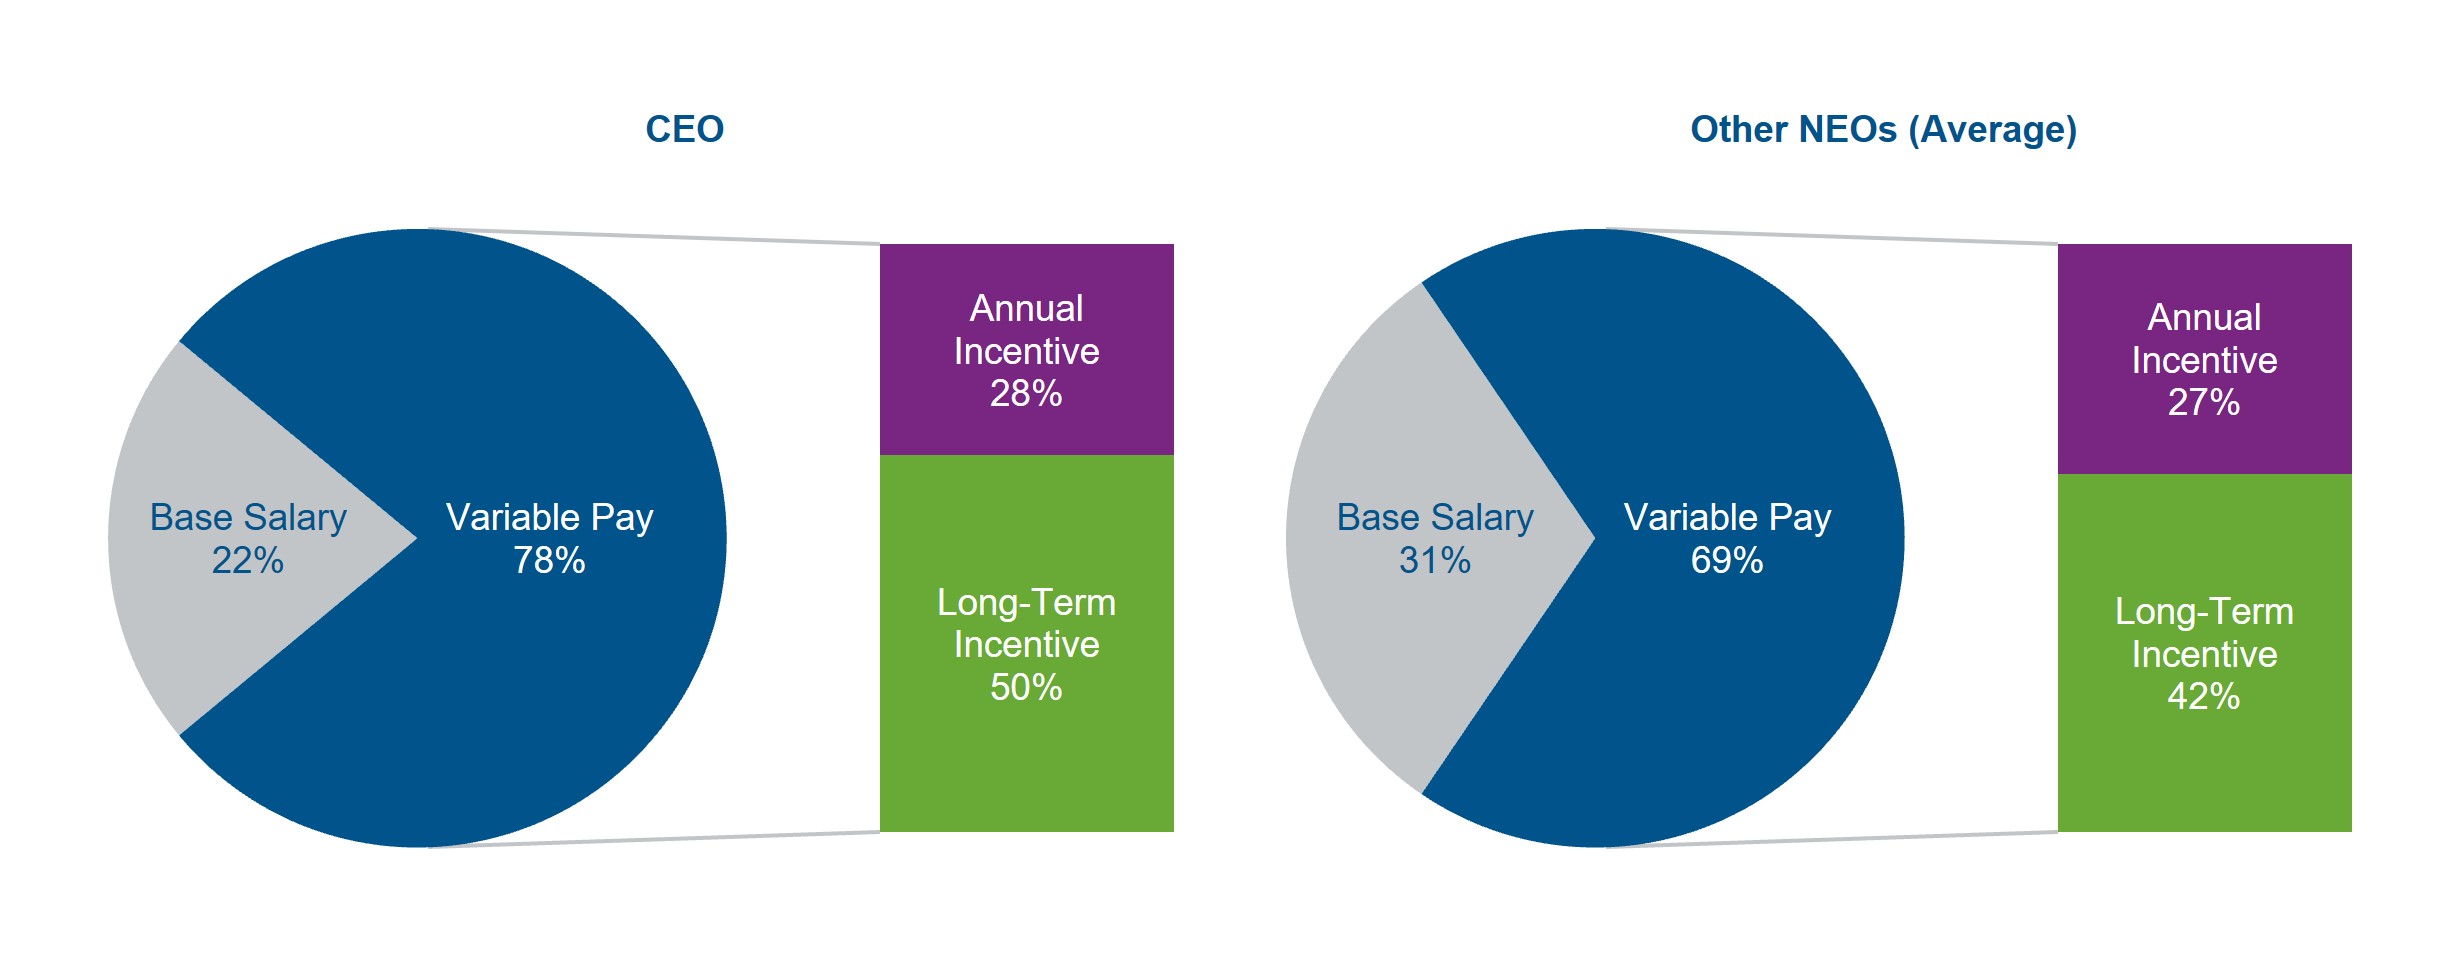
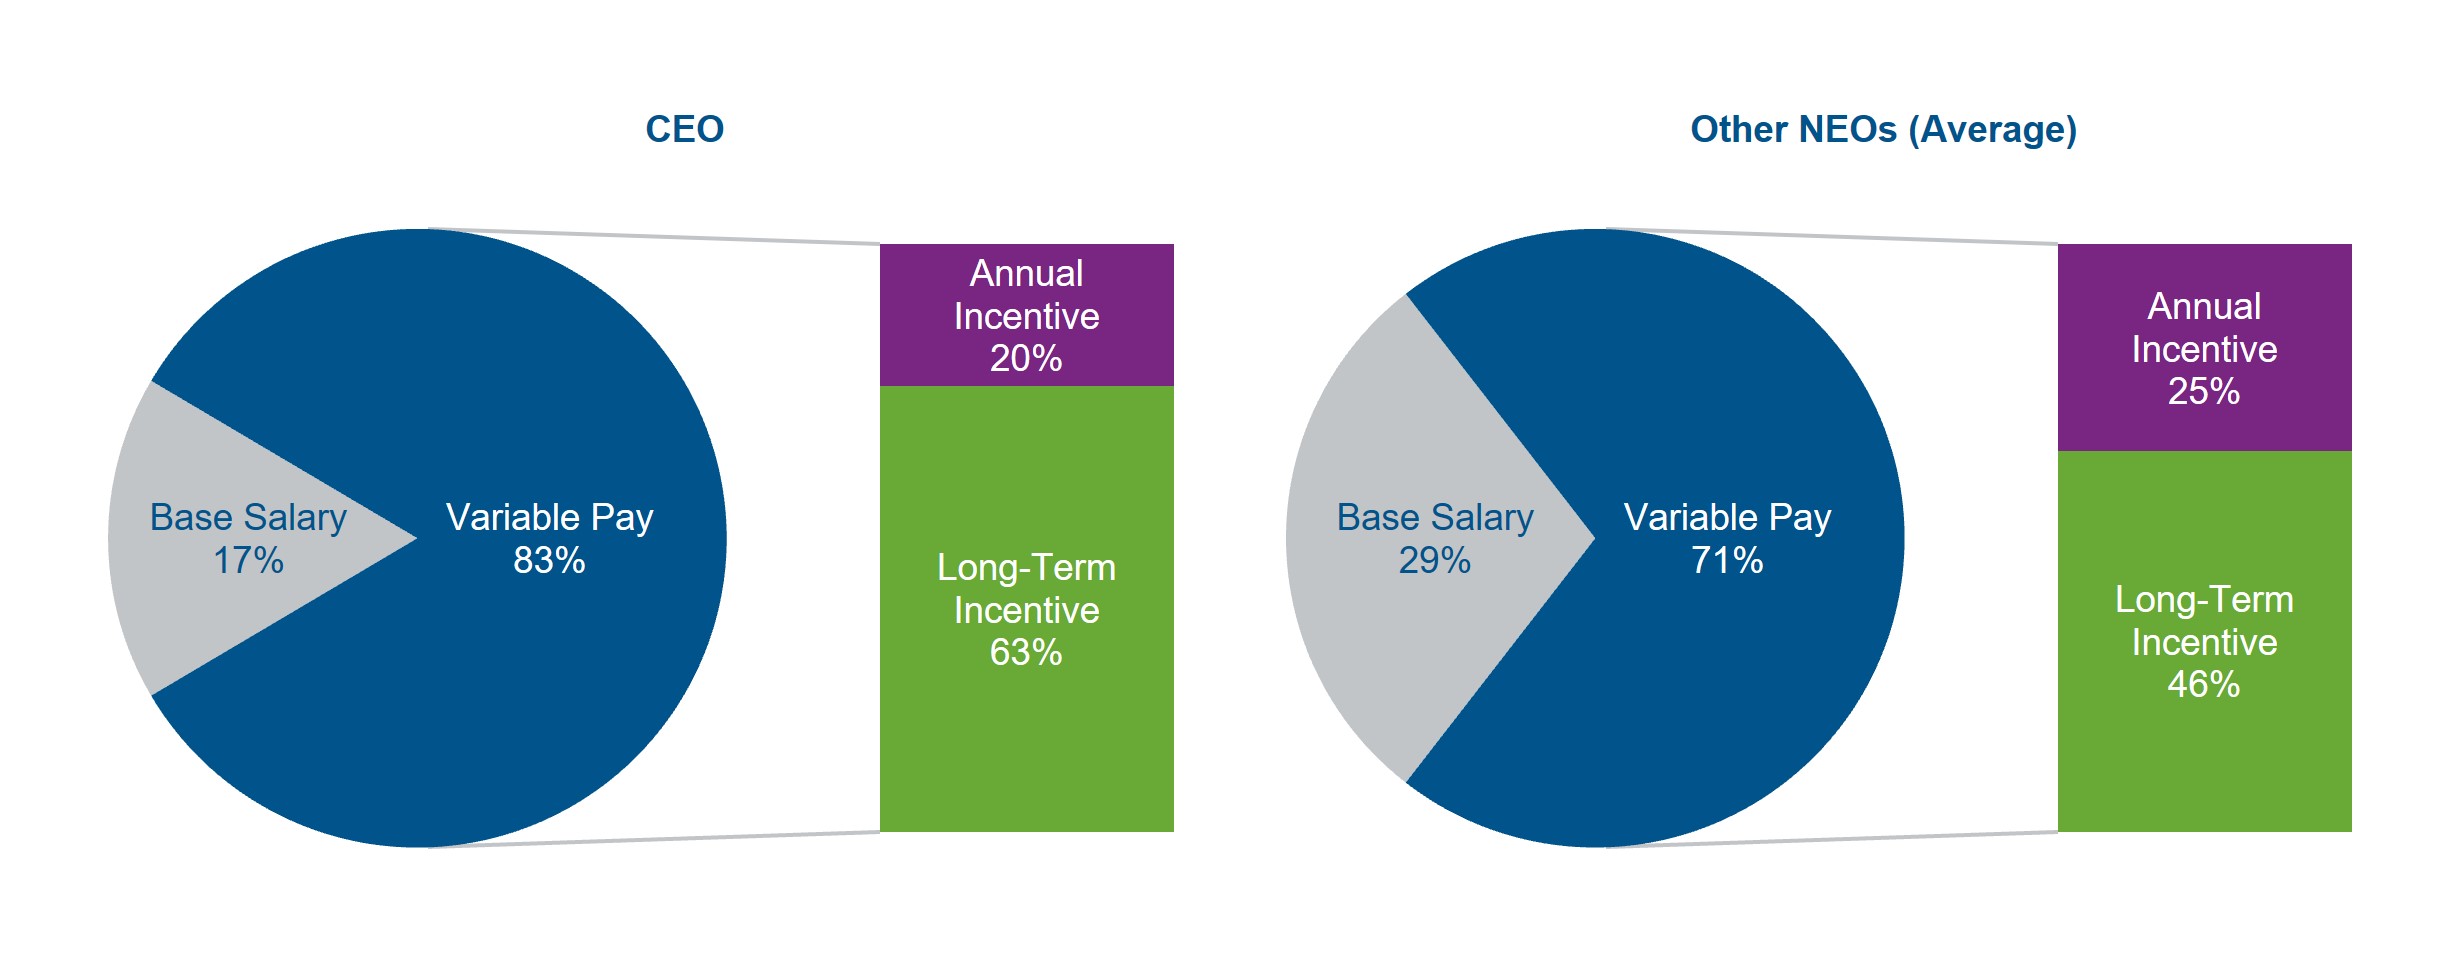
The 2023 program design continued to align our NEOs' interests with those of the stockholders by maintaining a majority of NEO compensation as performance-based and at-risk. The chart below illustrates the 2023 target mix of pay for the NEOs under the 2023 annual and long-term incentive programs.
2023 NEO Pay Mix at Target
GOVERNANCE OF EXECUTIVE COMPENSATION PROGRAM
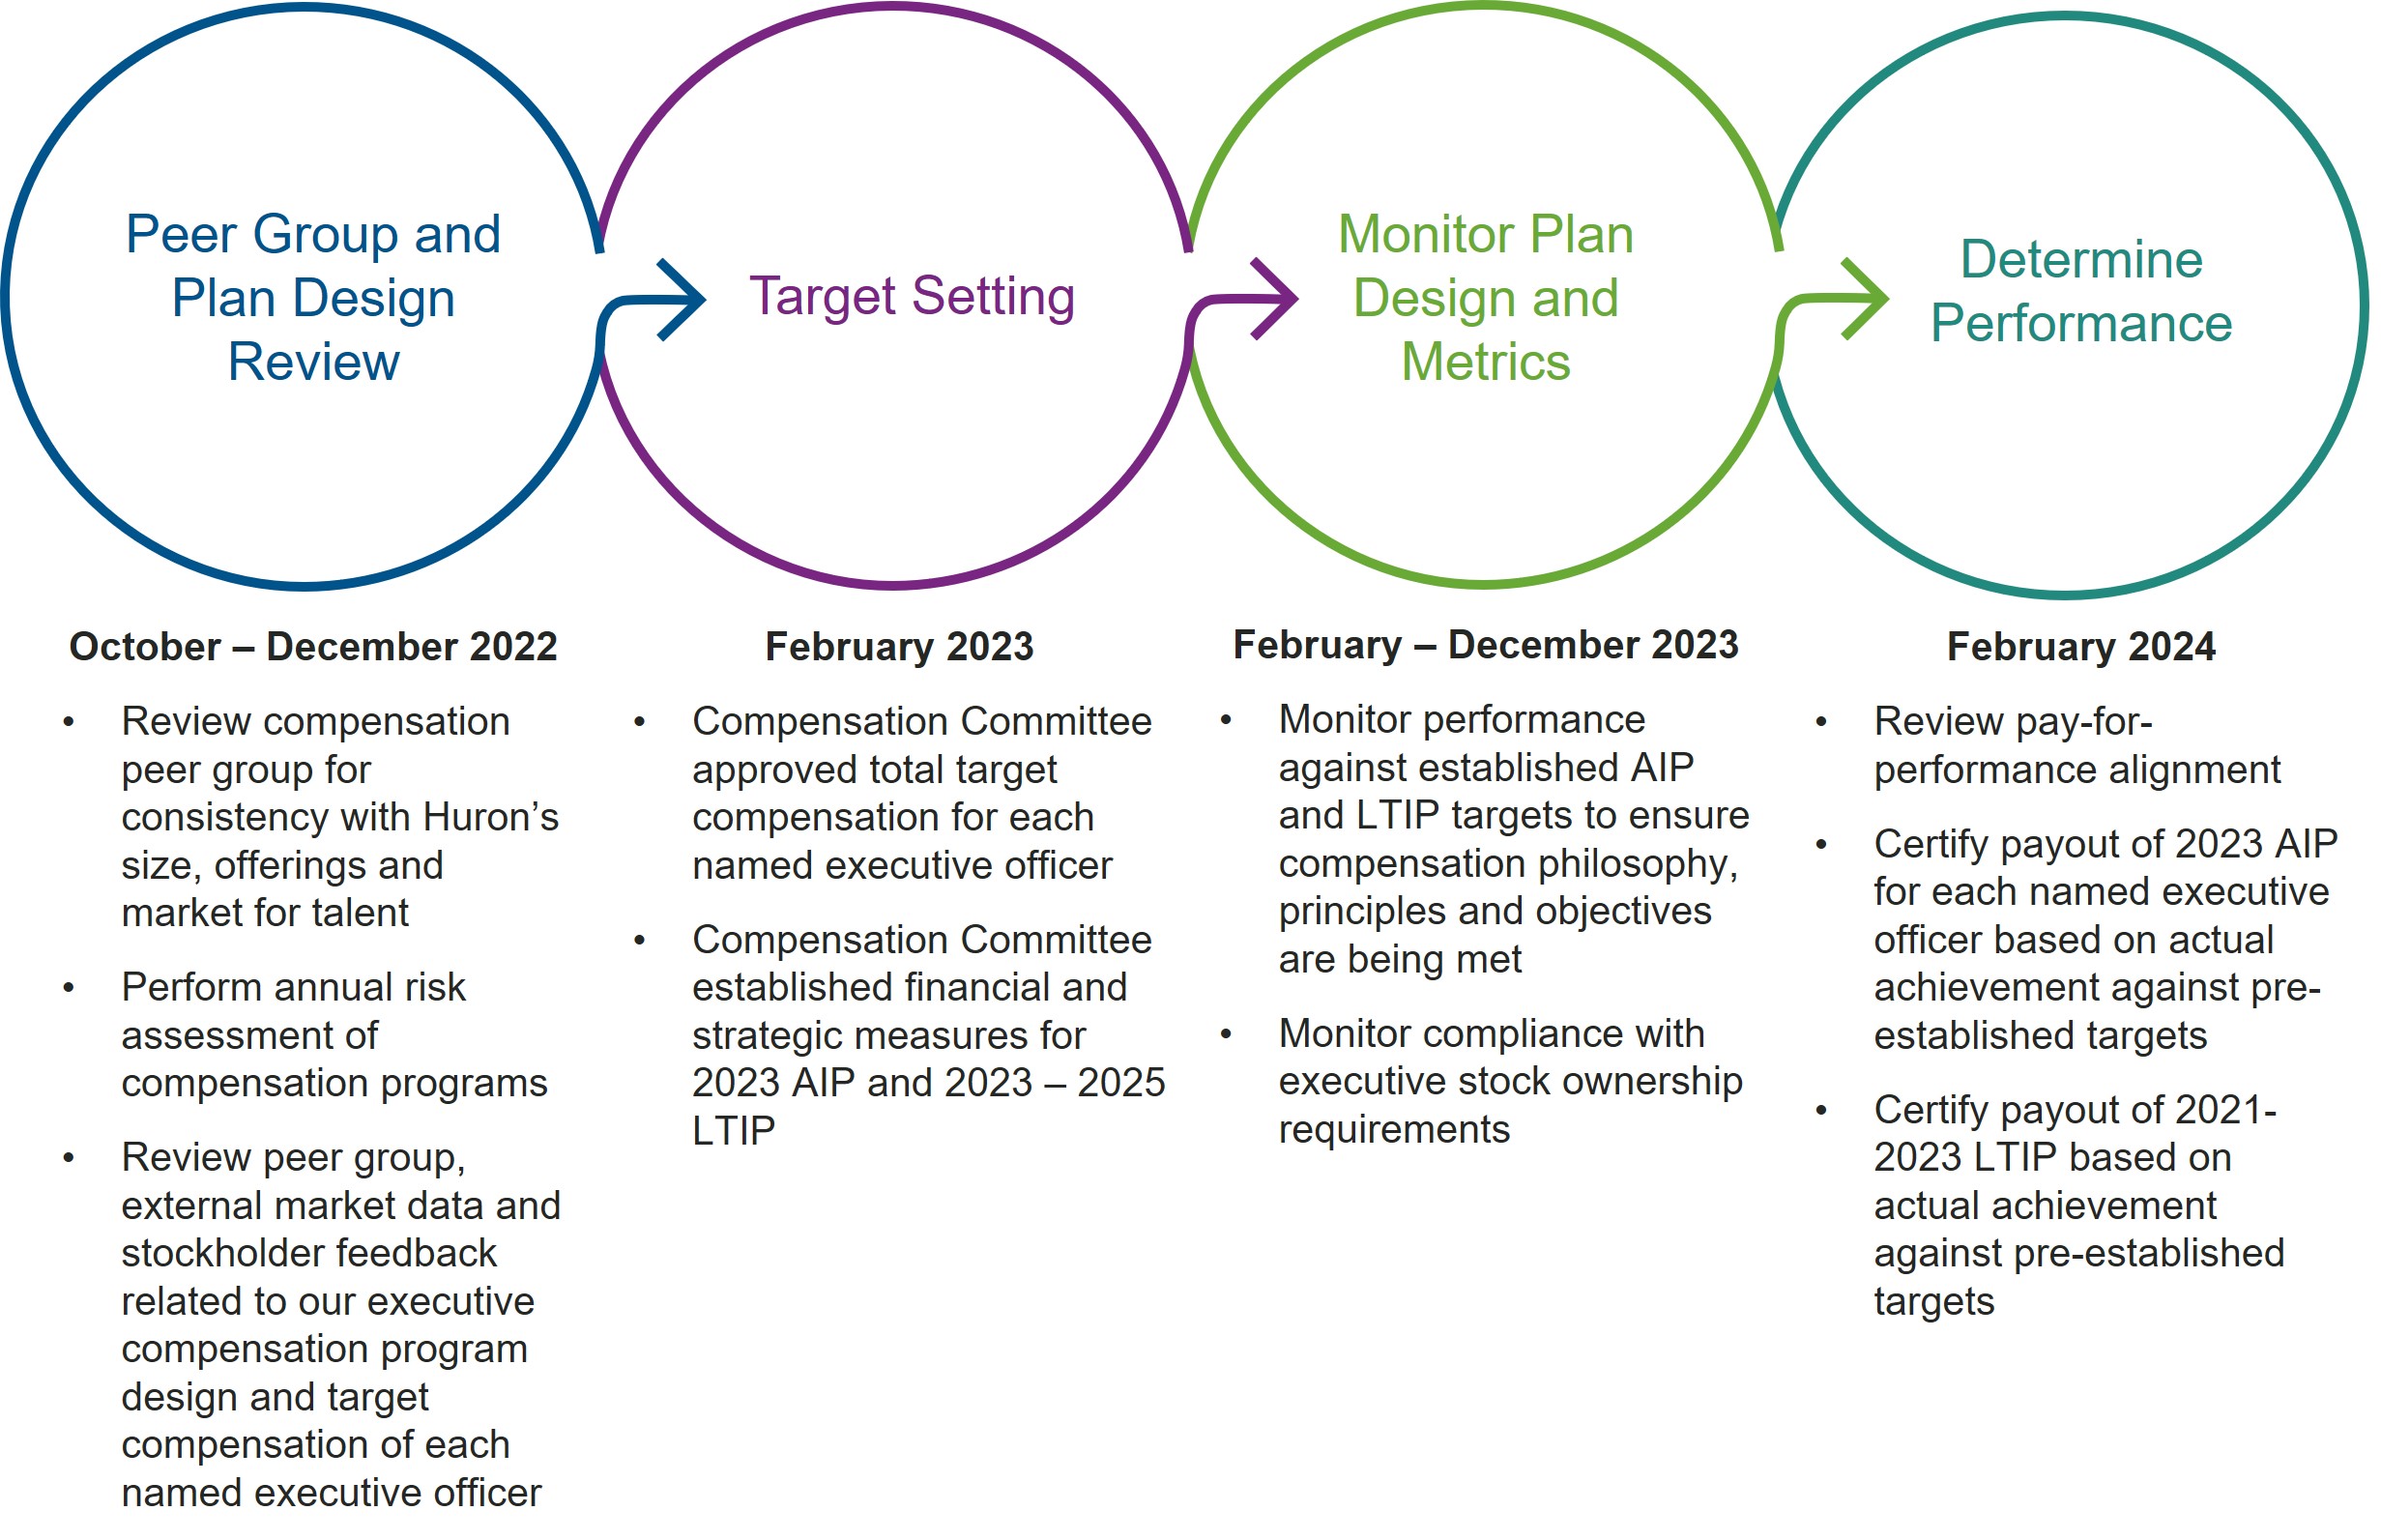
The Compensation Committee, with support from management and independent compensation consultants, is primarily responsible for designing, reviewing, and evaluating our executive compensation program in a manner consistent with our compensation philosophy, principles and objectives, through the following annual compensation-setting process.
Role of Compensation Committee
The Compensation Committee is primarily responsible for administering our executive compensation program in a manner consistent with our compensation philosophy and objectives. The principal functions of the Compensation Committee are to:
•set salaries and annual and long-term incentive levels for the CEO and other named executive officers, so that the program is promoting stockholder value;
•evaluate annually the performance of the CEO (in coordination with the full board) and review the CEO evaluation of the other named executive officers;
•review and approve the design and competitiveness of our executive compensation plans, including benefits and perquisites;
•review the design, competitiveness and pay equity of our Company-wide compensation plans, including benefits;
•review and approve the total cash and stock bonus pools for the organization, and approve the individual incentive payout awards for the named executive officers;
•review director compensation and make recommendations to the board;
•review and approve goals used for the annual and long-term incentive plans;
•retain or terminate, in its sole discretion, any independent compensation consultant used to assist the Compensation Committee;
•review and evaluate compensation arrangements to assess whether they could encourage undue risk-taking; and
•create a Compensation Committee report on executive compensation for inclusion in the Proxy Statement.
The Compensation Committee exercises its judgment on an independent basis and works closely with our board of directors and the executive management team in making many of its decisions. To support its decision making, the Compensation Committee has retained the services of an independent compensation consultant. The Compensation Committee has the sole authority to amend or terminate the services of its independent consultant.
The Compensation Committee is comprised entirely of independent directors.
Role of Management
Our CEO, along with the chief human resources officer and other members of senior leadership, support the Compensation Committee's design, review and evaluation of the executive compensation program. The executive officers provide recommendations for the financial and strategic measures within the annual incentive and long-term incentive programs, which are grounded in Huron's long-term growth strategy and market data. Additionally, our CEO provides a review of each named executive officer's annual performance but does not participate in the decisions related to his own compensation. The Compensation Committee carefully reviews and deliberates all recommendations provided by management.
Additionally, to support the Compensation Committee's review and approval of the total cash and stock bonus pools available for the organization, and to ensure the Company-wide compensation programs appropriately balance stockholder returns and employee retention, the executive officers regularly review Company, Industry and Capability performance with the Compensation Committee.
Role of Compensation Advisor
The Compensation Committee retains an independent advisor to assist in the ongoing assessment of our executive compensation strategy and program. The Compensation Committee's independent advisor reports directly to the Compensation Committee and serves at its sole discretion and does not perform any services for the Company other than those in connection with its work for the Compensation Committee. Pay Governance serves as the Compensation Committee’s independent advisor.
The Compensation Committee annually assesses whether the independent advisor's work has raised any conflict of interest. The Compensation Committee has determined, based on its analysis of NASDAQ requirements, that the work of Pay Governance and the individual compensation advisors employed by Pay Governance as compensation consultants to the Company has not created any conflict of interest.
Role of the Peer Group
The Compensation Committee reviews external market data to inform its decisions about executive compensation, specifically to determine a range of pay, inclusive of salary, target annual incentives, and target long-term incentive awards. Total direct
compensation, as well as the components thereof, are compared to similar roles and responsibilities for those of the Compensation Committee-approved peer group described below, as well as Radford Global Technology survey data for companies with comparable total revenues as Huron. Individual target pay is benchmarked against these external market sources, but can and does vary based on several factors including each individual executive officer's experience, qualifications and performance. We note that the Compensation Committee does not target NEOs’ pay to a specified percentile relative to the below Compensation Peer Group, but rather reviews peer group compensation data for each element of compensation, including base salary, cash annual incentive, long-term incentive targets, and target total compensation (target total cash plus long-term incentive compensation).
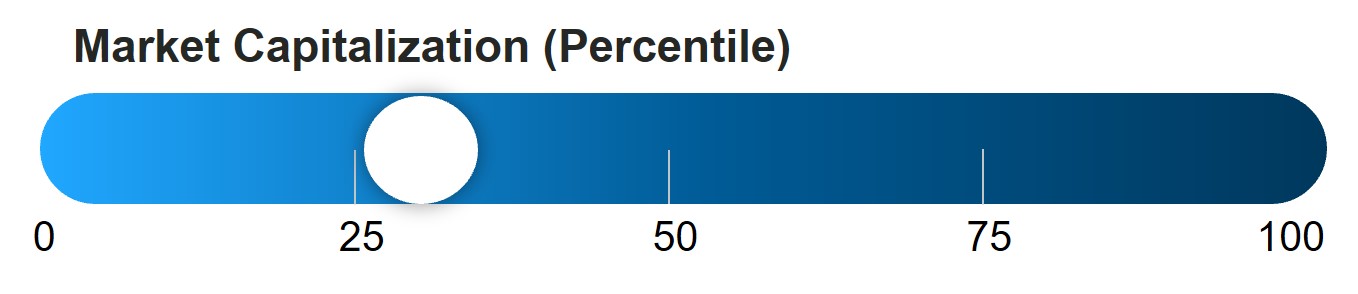
The peer group is comprised of U.S.-based companies who are business-to-business service providers in the Research and Consulting Services, Human Resource and Employment Services, Health Care Technology, Health Care Services, or IT Consulting and Other Services industry sectors with revenues within 0.1x to 5.5x of Huron’s revenues and market capitalization within 0.1x to 5.5x of Huron’s market capitalization as of the review date. Annually, the Compensation Committee reviews the composition of the peer group to determine whether any changes should be made. For 2023 executive compensation decisions, the Compensation Committee approved the addition of two new peers, Dun & Bradstreet Holdings, Inc. and Evolent Health, Inc. The addition of these two companies further aligns Huron's strategy of accelerating growth in our Healthcare and Education core markets and advancing our digital and analytics platform of technology services and products with the offerings of our peer group as both of these companies are digital-focused with offerings in our core industries.
Below is the list of fourteen (14) companies that comprised our peer group for 2023 compensation.
| | | | | |
| 2023 Peer Group | |
| CBIZ, Inc. | ICF International, Inc. |
| CRA International, Inc. | Korn Ferry |
| Dun & Bradstreet Holdings, Inc. | LiveRamp Holdings, Inc. |
| Evolent Health, Inc. | NextGen Healthcare, Inc. |
| Exponent, Inc. | Premier, Inc. |
| FTI Consulting Inc. | Resources Connection, Inc. |
| Heidrick & Struggles International, Inc. | Veradigm, Inc. |
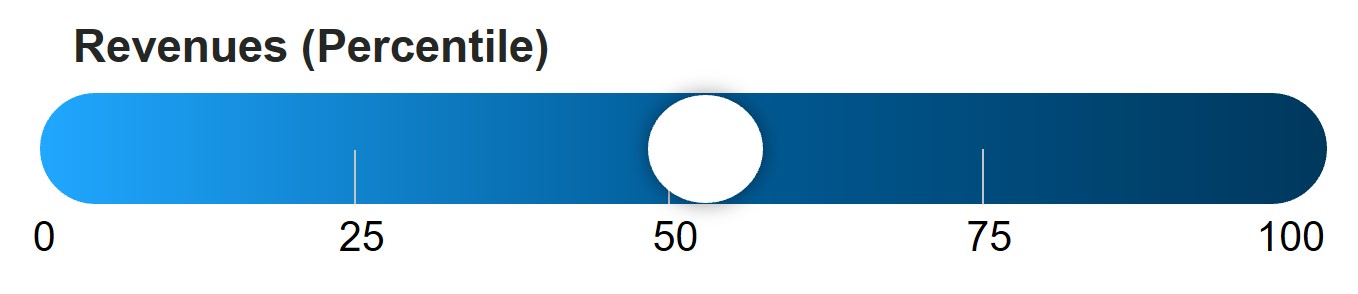
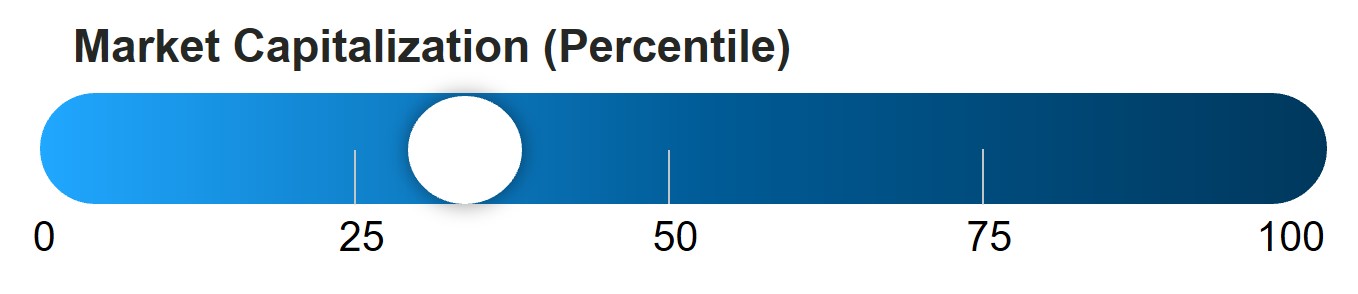
Huron's relative positioning of revenue and market capitalization to the selected peer group as of October 2022 when the peer group was approved:
2024 Peer Group and Pay Positioning
During the Compensation Committee's annual review of the peer group in October 2023, additional enhancements to the peer group were made for the 2024 executive compensation cycle. A comprehensive examination of our business results and growth strategy constituted the cornerstone for our 2023 analysis, culminating in a refinement of the industry peer group composition to recognize Huron's expanding portfolio of software and digital services offerings, which now represent over 40% of the Company's revenues. For 2024 executive compensation decisions, the Compensation Committee approved the addition of two new peers, Perficient, Inc. and R1 RCM, Inc., as well as the removal of Veradigm, Inc. Below is the approved list of fifteen (15) companies that comprised our peer group for 2024 compensation as well as Huron's relative positioning of revenue and market capitalization to the selected peer group as of October 2023 when the peer group was approved. We note Huron's relative positioning within this peer group and the median total direct compensation of the executive officers within the peer group, was not materially impacted by the changes made.
Below is the list of 15 companies that comprises our peer group for 2024 compensation.
| | | | | |
| 2024 Peer Group | |
| CBIZ, Inc. | Korn Ferry |
| CRA International, Inc. | LiveRamp Holdings, Inc. |
| Dun & Bradstreet Holdings, Inc. | NextGen Healthcare, Inc. |
| Evolent Health, Inc. | Premier, Inc. |
| Exponent, Inc. | Perficient, Inc. |
| FTI Consulting Inc. | R1 RCM, Inc. |
| Heidrick & Struggles International, Inc. | Resources Connection, Inc. |
| ICF International, Inc. | |
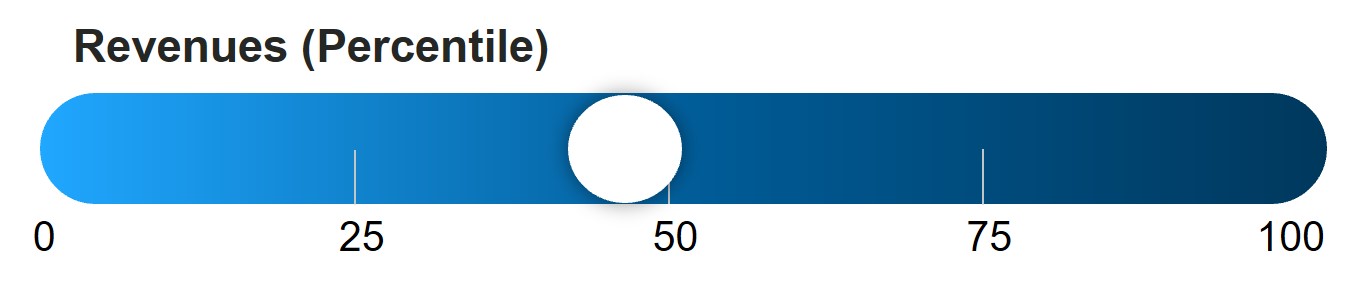
Huron's relative positioning of revenue and market capitalization to the selected peer group as of October 2023 when the peer group was approved:
At the 2023 Annual Meeting, 93% of votes cast were in support of our named executive officers' compensation ("say-on-pay"). We view these results as overwhelming support of our compensation programs, including their strong alignment between our executives' pay and stockholder value. Additionally, at the 2023 annual meeting, a significant majority of votes cast were in support of an annual advisory vote on executive officer compensation ("say-on-pay frequency") and Huron's board of directors determined that we will continue to listen carefully to our stockholders and hold our say-on-pay vote annually.
In addition to our annual say-on-pay vote, we maintain an ongoing dialogue with our stockholders around our growth strategy, competitive positioning, financial performance, and executive compensation philosophy and program, including offering one-on-one meetings to our top 25 stockholders. We engage in consistent, proactive outreach efforts with our shareholdersstockholders and their governance teams, as well as potential investors, on a regular basis throughout the year. Select membersOur non-executive chairman, chair of our board of directorsthe compensation committee and management team engage with our shareholdersstockholders to seek their input, andto remain well-informed of their perspectives, and to help increase their understanding of our business, our growth strategy, our executive compensation philosophy and program, and our commitment to corporate governance, environmental and social issues. issues, among other priorities.
Throughout
2021, we engaged with shareholders representing a significant percentage2023, those stockholders who accepted our offer to meet during our investor outreach cycles represented approximately 65% of our outstanding
shares.shares held by institutional investors as of December 31, 2023, including 15 of our top 25 stockholders. These conversations primarily focused on the evolution of Huron’s
strategyoperating model and
the impact of COVID-19;long-term strategy; our ongoing refresh process for the board of directors, including how we will continue to foster diversity among board members; and environmental, social and governance topics. We heard no concerns regarding our NEO pay
programs, including the 2021 cash retention award discussed further below. Our non-executive Chairman and the chair of the Compensation Committee were available for consultation with our major shareholders.programs. The feedback received through our
shareholderstockholder outreach efforts is communicated to and considered by the board and
when appropriate, informshelps inform our decisions and strategy.
2021 Say on Pay Vote
At the 2021 Annual Meeting, approximately 91% of votes cast were in support of our named executive officers’ compensation. We view these results as overwhelming support of our compensation programs, including their strong alignment between our executives’ pay and shareholder value, and the focused actions the Compensation Committee took in response to the impact of COVID-19 on our business and our people. We will continue to listen carefully to our shareholdersstockholders and incorporate their feedback into our decisions about executive compensation.
|
|
SECTION 3 - NEO COMPENSATION PROGRAM DETAILS
|
Targeting of Total Direct Compensation
The
2023 EXECUTIVE COMPENSATION DETAILS
2023 NEO Target Compensation
Committee generally targets total direct compensation to be within +/-15% of the median of the Executive Pay Peer Group for our NEOs. In addition to peer group data, the Compensation Committee also reviews survey data for companies with revenues between $500 million and $1 billion from the Radford Global Technology Survey. The Compensation Committee considers Huron’s competition for talent for the NEOs as well as managing directors to be broader than just the peer group companies, including other public and private consulting, strategy and technology organizations. When making compensation determinations, the Compensation Committee also considers the advice of our independent compensation consultant and applies its judgment in incorporating these and other factors.2021 NEO Compensation Opportunity
The Compensation Committee reviews NEO compensation for comparability and competitiveness to external market data and alignment with each executive's individual experience, qualifications and performance on an annual basis. In February 2021,2023, the Compensation Committee approved 2021the following 2023 target compensation levels with no changes from 2020 dueopportunities for our executive officers.
| | | | | | | | | | | |
| Name and Position | Base Salary | Target Annual Incentive Opportunity (% of Salary) | Target Long-Term Incentive Opportunity (% of Salary) |
| C. Mark Hussey | $925,000 | 125% | 225% |
| J. Ronald Dail | $650,000 | 90% | 125% |
| John D. Kelly | $575,000 | 100% | 175% |
| Ernest W. Torain, Jr. | $450,000 | 75% | 125% |
2023 Annual Incentive Program
The Compensation Committee continues to believe that the NEOs should be critically focused on improving stockholder value by driving and executing on the growth strategy of the organization and delivering results against the annual operating plan. As such, the Compensation Committee retained Organic Revenue Growth4 and Adjusted EBITDA Margin as the primary annual incentive financial metrics, and aligned the strategic measures to the continued uncertainty and ongoing impactcore principles of Huron's business strategy. As in the prior year, the combination of the COVID-19 pandemicfinancial metrics and the enumerative strategic measures results in approximately 90% of the total annual incentive opportunity tied to metrics that use predefined quantitative goals. Performance against each metric is measured independently. Each performance metric is measured in a range of 0 to 200%, with threshold performance achieving a 50% payout. While the annual incentive program requires the annual incentive payout to be capped at target if total shareholder return (TSR) is not positive for the year; the cap was not triggered in 2023 as TSR was 41.6%.
Additional detail on the
business at that time. The elements2023 annual incentive goals and performance achieved follows. As a result of
2021 compensation for each NEO are as follows: | | | | | | | | |
Compensation Element | | James H. Roth | | C. Mark Hussey | | John D. Kelly | | Ernest W. Torain, Jr. |
Base Salary | | $950,000 | | $800,000 | | $525,000 | | $360,000 |
Target AIP Opportunity (% of Salary) | | 140% | | 100% | | 90% | | 50% |
Target LTI Opportunity (% of Salary) | | 225% | | 175% | | 150% | | 90% |
In addition, in April 2021,the exceptional performance achieved, the Compensation Committee approved cash retention awardsa total payout of 145% of target for eachthe 2023 annual incentive program.
2023 Annual Incentive Goals
| | | | | | | | | | | | | | | | | | | | |
| Performance Measure | Weighting | Threshold | Target | Maximum | Actual | Payout % of Target |
| Organic Revenue Growth | 40% | $1,175M | $1,250M | $1,360M | $1,362M | 200% |
| Adjusted EBITDA Margin | 35% | 11.3% | 12.3% | 13.3% | 12.3% | 100% |
| Strategic Measures | 25% | Varies by measure - details below | 120% |
| Total | 100% | | 145% |
2023 Strategic Measures
The portfolio of
the NEOs to be paid if the NEO remains employed by Huron over a three-year period through March 1, 2024. For additional detail of these awards, please referstrategic measures applied to the
“2021 Cash Retention Award” section below.2021 Annual Incentive
The Compensation Committee approved the continued use of Organic Revenue Growth2, Adjusted EBITDA Margin and Strategic Measures as the three elements of the NEOs’2023 annual incentive program for 2021. The Compensation Committee electeddirectly aligned to enhance the Strategic Measures to include Environmental, Social and Governance (ESG) measures and increase the overall weightinggrowth strategy of the Strategic Measures to 25%organization through the following four principles: Grow Revenue, Grow Margins, Grow People and Financial Strength. Each of these goal's performance was assessed against pre-approved, defined measures of success, of which a majority were objective, quantifiable goals. In total, 60% of the totalstrategic measures within the 2023 annual incentive program were assessed against objective, quantifiable goals. The following chart outlines the 2023 goals as well as their weighting, alignment to provide sufficient weighting for the new ESG goals. Thestrategy and actual levels of achievement.
| | | | | | | | | | | | | | |
| Goals | Weighting | Alignment of Strategic Priorities with Company Strategy | Level of Achievement |
| Grow Revenue | 40.0% | Focused on executing against our growth strategy, including accelerating growth in the healthcare and education industries, advancing our portfolio of technology and analytic services and products, expanding our commercial business, growing our base of recurring revenue and further positioning our advisory capability for growth. | 48.7% | Exceeded our growth goals for the healthcare and education industries and digital capability. Achieved our growth goal for commercial industries of focus (e.g., financial services, energy and utilities and public sector). Defined the enterprise framework to further refine the Company’s operating model. Did not achieve our recurring revenue growth goal. |
| Grow Margins | 25.0% | Focused on executing our margin expansion strategy to improve profitability and increase our investment capacity. | 32.3% | Improved adjusted EBITDA margins by 70 bps over 2022 through initiatives focused on utilization, pricing, global delivery and SG&A leverage. |
4 Organic Revenue Growth financial measure retained its weighting of 40% and the Adjusted EBITDA Margin financial measure was reduced to a 35% weighting. | | | | | | | | | | | | | | |
| | | 2021 Annual Incentive Goals |
Performance Measure | | Weighting | | | Threshold | | Target | | Maximum | | Actual | | Payout %
of Target |
Organic Revenue Growth | | | 40% | | | $820.0M | | $860.0M | | $924.5M | | $903.6M | | 167.5% |
Adjusted EBITDA Margin | | | 35% | | | 10.3% | | 11.3% | | 12.3% | | 10.8% | | 64.0% |
Strategic Measures(1) | | | 25% | | | Varies by measure - details below | | 102.2% |
Total | | | 100% | | | | | 115.0% |
Total Awarded(2) | | | | | | | | 100.0% |
(1) | The majority of the Strategic Measures’ metrics and goals are objective and quantifiable, though some require a qualitative assessment of performance. The Compensation Committee approves the goals and assesses performance against predefined measures of success. Payouts range from 0-200% with a 25% minimum threshold. The following chart outlines the 2021 goals as well as their weighting, description and actual levels of achievement.
|
(2) | The NEO annual incentive program requires that awards be capped at target if the Company’s absolute total shareholder return during the year is not positive. While our revenue increased by 7.3%, adjusted EBITDA margin increased by 50 basis points, and adjusted EPS increased over 21% in 2021 compared to 2020, our absolute total shareholder return during 2021 was negative, reflecting continued volatility and uncertainty in the industries we serve, specifically healthcare and education, as a result of the COVID-19 pandemic. Therefore, the Compensation Committee capped the NEOs’ annual incentive award payout at target.
|
2 | Organic Revenue Growth excludes revenues generated by acquired businesses that are incremental to the acquisition revenues contemplated in the Annual Incentive Goals approved by the Compensation Committee.
|
2021 Strategic Measures
| | | | | | | | | | |
| | | |
Quantitative
Goals | | Weighting | | Alignment of Strategic Priorities with
Shareholder Value | | Level of Achievement |
Enterprise | | 16% | | Focused on advancing Huron’s strategy in the commercial markets and recurring revenue business models to further enable the Company’s long-term growth strategy and maintaining a strong balance sheet to support the Company’s balanced capital deployment allocation strategy. | | | 6.8% | | | Prioritized investments in growing businesses with recurring revenue, including our managed services offerings to build upon our current recurring revenue base. Did not achieve our annual free cash goal. |
Business Unit | | 32% | | Focused on achieving sustainable organic revenue growth over time. Measures included business unit-level revenue growth targets, new service line revenue growth targets and the successful integration of strategic acquisitions. Specific goals vary by business unit. | | | 45.4% | | | Executed Huron’s strategic plan, which included advancing and evolving new service lines to strengthen and expand our offerings, growing our core industries, and integrating our recent acquisitions. Did not achieve growth measures related to the Business Advisory business and the Life Sciences business. |
ESG | | 10% | | Focused on advancing our commitment to diversity, equity and inclusion by executing the initiatives set forth in our diversity and inclusion action plan. | | | 10.0% | | | Continued to foster an inclusive culture that encourages diversity. Advanced diverse representation across the organization. Executed our regular pay equity study to help ensure fair and equitable compensation for all employees. Expanded our community outreach support. |
| | | |
Qualitative
Goals | | Weighting | | Alignment of Strategic Priorities with
Shareholder Value | | Level of Achievement |
Enterprise | | 16% | | Focused on mitigating further impacts to the business driven by the ongoing impact of the COVID-19 pandemic and enhancing Huron’s integrated operating model and capabilities to drive growth across the business. | | | 16.0% | | | Developed a flexible COVID-19 reentry plan that met the needs of our clients while maintaining the health and safety of our employees. Refined Huron’s plan to become a more integrated operating company. Invested in business and greatest potential of developing recurring revenue business models. |
Business Unit | | 16% | | Focused on strategically positioning Huron to achieve sustainable organic revenue growth over time, including advancing growth priorities and capabilities that support Huron’s enterprise-level strategy. Specific goals vary by business unit. | | | 14.0% | | | Areas of focus included successfully launching new service lines, building upon the foundation in key growth areas, and advancing our practice strategies. Did not achieve Life Sciences-focused measures given the divestiture of the business unit in Q4 2021. |
ESG | | 10% | | Focused on advancing our commitment to diversity, equity and inclusion by executing the initiatives set forth in our diversity and inclusion action plan across all levels of the organization, ensuring fair and equitable compensation, expanding community outreach and strengthening vendor processes. | | | 10.0% | | | Joined the CEO Action for Diversity & Inclusion coalition. Established new apprenticeship, sponsorship and development programs to create opportunities for learning, networking and leadership development. See Huron’s annual Environmental, Social and Governance report for further details. |
Total | | 100% | | | | | 102.2 | % | | |
2021 Long-Term Incentive
Given the uncertainty of the recovery of our business from the impact of the COVID-19 pandemic and the Compensation Committee’s desire to provide a competitive earning opportunity aligned with shareholder value,Committee.
| | | | | | | | | | | | | | |
| Grow People | 25.0% | Focused on advancing our commitment to our people while attracting, engaging, motivating and retaining top talent to support our strategic objectives and growth goals. | 27.5% | Achieved our priorities to advance our commitment to our employees in 2023 realizing strong employee engagement and coach quality feedback results, improving employee retention and strengthening the overall employee experience by bringing greater transparency to professional development and career progression. As well, furthered our talent management efforts with reprised senior leadership succession activities and refreshed talent management and development activities. |
| Aligned with our ESG strategy, focused on advancing our commitment to diversity, equity and inclusion by executing the initiatives set forth in our diversity and inclusion action plan. | 3.2% | Continued to foster a culture of belonging and inclusivity, advance diverse representation and expand our community outreach, including (but not limited to) aligning the senior leadership team as executive champions for each of our nine employee resource groups (iMatter teams), establishing DEI partnerships to improve networking, sourcing and development, and launching the Women in India and Women of Color subcommunities of our Women iMatter team. |
| Financial Strength | 10.0% | Focused on maintaining a strong, flexible balance sheet to support the achievement of Huron’s strategy while returning capital to shareholders and allowing for capacity for strategic tuck-in M&A. | 8.8% | Achieved our 2023 free cash flow and leverage goals. |
| Total | 100% | | 120.5% | |
2023 Long-Term Incentive Program
Under the
Compensation Committee elected to make two temporary changes to the NEO2023 long-term incentive program,
for 2021:Maintain majority weighting on performance units but temporarily reduce weightingwhich was unchanged from the prior year, 70% to 60% of the target awardlong-term incentive program value to better reflect market competitive practices.
| • | | Retain three-year cumulative performance cycle and three-year cliff vesting, but set annual goals for both Adjusted Diluted EPS and Revenue Growth3, which balances the focus on long-term profitable growth with the continued uncertainty resulting from the pandemic. Final payout will be determined at the endwas granted in the form of the full three-year period by averaging each years’ actual annual performance against the annual target set for that year, and then applying a multiplier in a range of 90% to 110% based on performance against Compensation Committee-approved three-year Revenue Growth goals. As in prior years, we cannot disclose the three-year goals at this time due to their material, non-public nature. See below for the 2021 goals approved by the Compensation Committee and the performance against the approved goals.
|
On March 1, 2021, the Compensation Committee awarded our NEOs performance share units (PSUs) and 30% was granted in the form of restricted shares under the long-term incentive plan of the following amounts:
| | | | | | | | | | |
| Executive | | Performance
Share
Units(1) | | Restricted
Shares |
James H. Roth | | | | 23,860 | | | | | 15,907 | |
C. Mark Hussey | | | | 15,628 | | | | | 10,419 | |
John D. Kelly | | | | 8,791 | | | | | 5,860 | |
Ernest W. Torain, Jr. | | | | 3,617 | | | | | 2,411 | |
(1) | As shown in the table above, the Compensation Committee awarded a total of 51,896 performance share units under the 2021 long-term incentive plan; however, only one-third of the performance shares awarded were granted as defined under FASB ASC Topic 718. The one-third of performance shares granted represent the shares eligible to be earned based on performance against the approved 2021 annual goals and three-year revenue goal at the end of 2023. As the annual goals against which the second and third components will be measured will be approved by the Compensation Committee in February 2022 and February 2023, the related shares were not granted in 2021 as defined by FASB ASC Topic 718. The 51,896 performance share units awarded and reflected in the table above reflects the cumulative target shares to be granted over the three-year performance period.
|
2021 Performance on Long-Term Incentive
The Compensation Committee established the following 2021 goals for Adjusted Diluted EPS and Revenue Growth3stock units (RSUs), eachboth with a 50% weighting, to determine the number of earned shares for the first component of the 2021 long-term incentive. Finalthree-year vesting period. The final payout of the entire 2021 long-term incentive programPSUs granted in 2023 will be determined at the end of the full three-year period after incorporating our performance against the Compensation Committee-approved three-year Revenue Growth goals. No shares will vest under this program until the conclusion of the full three-year performance period.
| | | | | | | | | | |
| Performance Measure | | Weighting | | Threshold | | Target | | Maximum | | Actual |
Adjusted Diluted EPS | | 50% | | $2.10 | | $2.50 | | $3.00 | | $2.61 |
Revenue Growth | | 50% | | $820M | | $860M | | $925M | | $906M |
3 | Revenue Growth includes all revenues recognized during the period in accordance with accounting principles generally accepted in the United States of America (“GAAP”).
|
Outstanding Performance Share Grants
There were three outstanding PSU cycles during 2021, those granted in 2019, 2020 and 2021. The actual shares that may be earned is determined based on performance against two predetermined, absolute goals: 1) Adjusted Diluted EPS and 2) Revenue Growth. Thecumulative three-year goals for Adjusted Diluted EPS and Revenue Growth, with fifty-fifty weighting. As in prior years, we cannot disclose the details of the three-year goals forat this time due to their material, non-public nature.
Previously Awarded Performance-Based Long-Term Incentive Programs
2021-2023 Performance Cycle
Given the 2019uncertainty of the impact of the COVID-19 pandemic and 2020 PSU grants are based onthe Compensation Committee's desire to still provide a cumulative three-year performance period.competitive earning opportunity aligned with stockholder value during that unprecedented period, the 2021 PSUs were granted under a temporarily modified long-term incentive program. The 2021 PSU grant retained a three-year cumulative performance cycle but will2021-2023 long-term incentive program set annual goals annually for both Adjusted Diluted EPS and Revenue Growth, and then applied a multiplier in a range of 90% to 110% based on performance against Compensation Committee-approved three-year Revenue Growth goals. The final payout was determined at the beginningend of 2023 by averaging each year's actual annual performance against the annual target set for that year, and then applying the three-year Revenue Growth multiplier. See below for details on the 2023 annual goals and the three-year Revenue Growth goals approved by the Compensation Committee. The 2021 and 2022 annual goals were reported in the proxy statements covering the respective performance cycle, withperiod.
| | | | | | | | | | | | | | | | | | | | |
| Performance Measure | Weighting | Threshold | Target | Maximum | Actual | Payout % of Target |
| 2023 Annual Goals | | | | | | |
| Adjusted Diluted EPS | 50% | $3.60 | $4.00 | $4.50 | $4.91 | 200% |
| Revenue Growth | 50% | $1,210M | $1,250M | $1,315M | $1,362M | 200% |
| Total | 100% | | | | | 200% |
| | | | | | |
| 2021-2023 Cumulative Revenue Growth Goals |
| Revenue Growth | 100% | $2,632M | $2,738M | $2,847M | $3,400M | 110% |
The table below illustrates the overall payout earned for the 2021 PSUs, which was 194% of target.
| | | | | | | | | | | | | | |
| Performance Measure | Overall Weighting | Adjusted Diluted EPS Payout % of Target Earned
(50% Weighting) | Revenue Growth Payout % of Target Earned
(50% Weighting) | Total Payout % of Target Earned |
| Annual Performance | | | | |
| 2021 | 33% | 122% | 170% | 146% |
| 2022 | 33% | 166% | 200% | 183% |
| 2023 | 33% | 200% | 200% | 200% |
| Total | 100% | | | 176% |
| | | | |
| 2021-2023 Cumulative Revenue Growth Multiplier |
| Revenue Growth | | | | 110% |
| | | | |
| Total | | | | 194% |
2022-2024 Performance Cycle
The final payout
toof the PSUs granted in 2022 will be determined at the end of the full three-year
performance period
and incorporate ourbased on performance against
athe predetermined, cumulative three-year
Revenue Growth goal.The Compensation Committee did not make any modifications to the outstanding awards in 2020 or 2021, despite the significant unforeseen negative impact of COVID-19 on the estimated payouts for the 2019 and 2020 NEO PSU awards.
| | | | |
Performance Cycle
| | | | Estimated Payout as a % of
Target - Performance Through
12/31/2021
|
2019 - 2021(1)
| | | | 73% |
2020 - 2022
| | | | —% |
2021 - 2023
| | | | 100% |
(1) | The 2019-2021 performance cycle payout is based on actual performance. The 2020-2022 and 2021-2023 is an estimate based on actual performance through 2021 and estimated performance for the remainder of the performance cycle.
|
Performance Unit Awards
Performance units may be earned and settled in shares at the end of a full three-year performance period, depending on the level of performance achieved. The Compensation Committee approves the absolute goals for both Adjusted Diluted EPS and Revenue Growth, including establishing a threshold level below which no performance units will vest. These goals are communicated towith fifty-fifty weighting. As in prior years, we cannot disclose the NEOs at the time of grant, but we do not share them publicly until the enddetails of the performance periodthree-year goals at this time due to prevent us from sharing otherwisetheir material, non-public information about our financial forecast.
Restricted Shares
Restricted shares vest ratably over nature.
2024 EXECUTIVE COMPENSATION DETAILS
During the Company's annual compensation review, which included a
three-year period, beginning on the first anniversaryreview of the
dateexceptional performance in 2023, total direct compensation of
grant.Performance Unit Vesting
our peer group and other market data, the Compensation Committee determined that an overall increase in total direct compensation was appropriate. The 2019 awardincrease in total direct compensation is primarily achieved through increasing the variable "at-risk" portion of performance units completed its three-year performance cycle as of December 31, 2021.executive pay through increased performance-based equity awards under the upcoming 2024 long-term incentive program. The table below illustratesadjustments made for 2024 drive improved competitiveness by better aligning each executive's total direct compensation with the structuretotal direct compensation received by similarly situated executives of the performance unitsCompany's peer group and enhancing the alignment of the executive's interests with the long-term interests of stockholders as a greater portion of total direct compensation is granted in 2019.
| | | | | | | | | | |
| Performance Measure | | Weighting | | Threshold | | Target | | Maximum | | Actual |
Adjusted Diluted EPS | | 57% | | $6.75 | | $7.94 | | $9.14 | | $7.50 |
Revenue Growth | | 43% | | $2,541M | | $2,674M | | $2,982M | | $2,627M |
As a resultperformance-based equity. The Company continues to remain active with its share repurchase program in order to mitigate any potential dilution effect of the actual performance achieved,increased equity award grants.
For 2024, the Compensation Committee approved vestingthe following compensation for the NEOs:
| | | | | | | | | | | |
| Name and Position | Base Salary | Target Annual Incentive Opportunity (% of Salary) | Target Long-Term Incentive Opportunity (% of Salary) |
| C. Mark Hussey | $950,000 | 140% | 375% |
| J. Ronald Dail | $675,000 | 90% | 140% |
| John D. Kelly | $600,000 | 115% | 220% |
| Ernest W. Torain, Jr. | $450,000 | 75% | 125% |
The chart below illustrates the target mix of
73% ofpay for the
original target number of performance units.2021 Cash Retention Award
DuringNEOs under the course of 2020, the Compensation Committee spent considerable time discussing the impact of the COVID-19 pandemic on the Company’s business, customers and personnel and the related impact of the pandemic on the Company’s short2024 annual and long-term compensationincentive programs. After thorough consideration, the Compensation Committee decided not to make any adjustments to the pre-established financial performance metrics, performance periods or any other elements of the outstanding long-term incentive plans in 2020. The decision was based principally on two factors. First, the Compensation Committee was extremely reluctant to change performance targets in the middle of a plan cycle since the Compensation Committee did not believe this to be a good practice and, despite the extraordinary circumstances presented by the pandemic, did not
exercise discretion to do so. Second, in light of the uncertainty created by the pandemic, the Compensation Committee did not believe it had enough insight into the potential future impact of the pandemic to establish meaningful and sustainable revised performance targets.
While the Compensation Committee did not adjust outstanding long-term incentive awards to address the very negative impact of the pandemic on multi-year performance cycles for the reasons discussed above, the Compensation Committee believed that the Company’s executive officers performed exceptionally in leading the Company during 2020 and that it was critical to implement a three-year retention program to ensure their continued leadership, specifically over the next few years as the challenges presented by the pandemic persist. As a result, in April 2021, the Compensation Committee approved retention awards to each2024 NEO through which each named executive officer is entitled to a cash payment so long as he remains continuously employed by Huron through the applicable vesting date. The total amount of the cash retention awards that could be earned are as follows: James H. Roth—$2,220,000; Mark Hussey—$1,290,000; John D. Kelly—$615,000; Ernest W. Torain—$240,000. One-third of such amount will be payable on each of March 1, 2022, March 1, 2023 and March 1, 2024 if the NEO remains continuously employed by Huron through such date. The Compensation Committee approved the payment of the awards in cash rather than equity, to align with our ongoing efforts to minimize dilution and manage our burn rate. These cash retention agreements were approved in response to extremely unique circumstances in 2021 stemming from the COVID-19 pandemic, and we do not intend to provide any cash-based retention awards to our NEOs in the future. Throughout 2021, we engaged with shareholders representing a significant percentage of our outstanding shares which included discussions of our NEO pay programs. During our outreach, we heard no concerns regarding our NEO pay programs, including the cash retention award.
2022 NEO Compensation Program
Pay Mix at Target
The Compensation Committee and management continue to believe that the NEOs should be critically focused on improving
shareholderstockholder value through driving the profitable growth of the
organization.Company. As such, under the
20222024 annual incentive program, the Compensation Committee retained Organic Revenue Growth and Adjusted EBITDA Margin as the primary annual incentive financial metrics, with a combined 75% weighting. The Compensation Committee and management also recognize the importance of the nature by which these financial results are achieved and retained
Strategic Measures, including Environmental, Social and Governance (ESG) goals, with a 25%
weighting. As inweighting on the
prior year,strategic measures, the majority of which continue to be assessed against predefined, quantitative goals that align with the company's strategic objectives. The financial goals and the executive strategic measures combined ensure that nearly 90% of the total annual incentive opportunity is tied to
metrics that usepredefined measures with predefined quantitative
goals and performance assessment.metrics.
Additionally, the Compensation Committee
elected to returnmaintained the
2022 long-term incentive program
to the design used
prior to 2021 due to the positive financial performance in
2021, increased clarity around future performance amidst the COVID-19 pandemic and a preference to use multi-year goals in assessing long-term performance. As such,2023. Under this program, 70% of the target long-term incentive program value was granted in the form of PSUs and 30% was granted in the form of RSUs. The final payout of the PSUs will be determined at the end of the full three-year period based on performance against predetermined,
three-year cumulative
three-year goals for Adjusted Diluted EPS and Revenue Growth. As in prior years, we cannot disclose
thesethe specific goals at this time due to their material,
non-public nature.
For 2022, the Compensation Committee made the following compensation adjustments for Mr. Kelly and Mr. Torain in recognition of their individual performance and contributions as well as part of a multi-year strategy to position their pay closer to market median:
Mr. Kelly’s long-term incentive opportunity increased from 150% to 170%. 2022 will be Mr. Kelly’s sixth year in the role.
Mr. Torain’s base salary increased from $360,000 to $400,000 and his long-term incentive opportunity increased from 90% to 115%. 2022 will be Mr. Torain’s third year in the role.
|
|
SECTION 4 - ADDITIONAL INFORMATION ON OUR COMPENSATION PROGRAMS |
Competitive Market Data
The Compensation Committee reviews external market data to inform its decisions about NEO target pay opportunities. When determining NEO pay for 2021, the Compensation Committee relied on two market data sets:
| 1. | Publicly reported compensation data from a Compensation Committee-approved peer group
|
| 2. | Survey data for similarly sized companies
|
In October 2020, the Compensation Committee approved two changes for the 2021 peer group:
Navigant Consulting Inc. was removed as it was acquired in October 2019 which resulted in a lack of public NEO pay data.
Allscripts Healthcare Solutions, Inc. was added because it met the screening criteria described below.
The 2021 peer group consisted of the following 13 companies:
| | |
Allscripts Healthcare Solutions, Inc.
| | ICF International, Inc.
|
CBIZ, Inc.
| | Korn Ferry
|
CRA International, Inc.
| | LiveRamp Holdings, Inc.
|
Exponent, Inc.
| | NextGen Healthcare, Inc.
|
FTI Consulting Inc.
| | Premier, Inc.
|
Heidrick & Struggles International, Inc.
| | Resources Connection, Inc.
|
HMS Holdings Corp.
| | |
The peer companies represent business-to-business service providers in the Research and Consulting Services, Human Resource and Employment Services, Health Care Technology, Health Care Services, or IT Consulting and Other Services industry sectors with:
Revenues from 0.4x to 2.5x Huron’s revenues and
ADDITIONAL EXECUTIVE COMPENSATION DETAILSMarket capitalization 0.1x to 5x Huron’s market capitalization.
Survey data represents companies with revenues between $500 million and $1 billion from the Radford Global Technology Survey.
Employment Agreements
Huron has entered into agreements with each of the named executive officers that provide for benefits upon termination of employment under certain circumstances, including in connection with a change of control of the Company. Huron provides these benefits as a means of remaining competitive, retaining executive officers, focusing executive officers on
shareholderstockholder interests when considering strategic alternatives and providing income protection in the event of involuntary loss of employment. In general, these arrangements provide for severance benefits upon Huron’s termination of the executive’s employment without cause or resignation by the executive for good reason (constructive termination). In the event of a change of control of Huron and if the executive’s employment is terminated without cause or he resigns for good reason, the executive will receive enhanced severance benefits. Huron provides these enhanced severance benefits only with a
“double trigger”"double trigger" because the Company believes that the executive officers would be materially harmed in a change of control only if it results in reduced responsibilities or compensation or loss of employment for the executive. Huron employment agreements do not provide for any
gross-ups.More information on our use of employment agreements, including the estimated payments and benefits payable to the named executive officers, is provided under the “Potential"Potential Payments Upon Termination or Change of Control”Control" section of this Proxy Statement.
Role of Compensation Committee
The Compensation Committee is primarily responsible for administering our executive compensation program in a manner consistent with our compensation philosophy and objectives. The principal functions of the Compensation Committee are to:
set salaries and annual and long-term incentive levels for the CEO and other named executive officers, so that the program is promoting shareholder value;
evaluate annually the performance of the CEO (in coordination with the full board) and review the CEO evaluations of the other named executive officers;
review and approve the design and competitiveness of our compensation plans, executive benefits and perquisites;
review and approve the total cash and stock bonus pools for the organization, and approve the individual incentive payout awards for the named executive officers;
review director compensation and make recommendations to the board;
review and approve goals used for the annual and long-term incentive plans;
retain or terminate, in its sole discretion, any independent compensation consultant used to assist the Compensation Committee;
review and evaluate compensation arrangements to assess whether they could encourage undue risk taking; and
create a Compensation Committee report on executive compensation for inclusion in the Proxy Statement.
The Compensation Committee acts independently and works closely with our board of directors and the executive management team in making many of its decisions. To support its decision making, the Compensation Committee has retained the services of an independent compensation consultant. The Compensation Committee has the sole authority to amend or terminate the services of its independent consultant.
In 2021, the Compensation Committee was comprised entirely of independent directors.
Role of Management
Our CEO works together with the Chief Human Resources Officer and the Compensation Committee of our board to establish, review and evaluate compensation packages and policies for our executive officers. Our CEO reviews the performance of each named executive officer and makes recommendations to the Compensation Committee based on his review. Our CEO, COO and President, CFO and General Counsel provide input into our strategic goals for future performance periods. The Compensation Committee carefully reviews all information before finalizing incentive goals, as we believe such a process is consistent with good governance. Prior to determining the size of the bonus pool for all employees other than NEOs, management reviews Company and practice-level performance with the board so that the bonus pool and Company profitability balances shareholder returns and retention of employees. Our CEO does not participate in the decisions related to his own compensation.
Role of Compensation Advisor
The Compensation Committee retains an independent advisor to assist in the ongoing assessment of our executive compensation strategy and program. The Compensation Committee’s independent advisor reports directly to the Compensation Committee and serves at its sole discretion and does not perform any services for the Company other than those in connection with its work for the Compensation Committee. Pay Governance serves as the Compensation Committee’s independent advisor.
The Compensation Committee annually assesses whether the independent advisor’s work has raised any conflict of interest. The Compensation Committee has determined, based on its analysis of NASDAQ requirements, that the work of Pay Governance and the individual compensation advisors employed by Pay Governance as compensation consultants to the Company has not created any conflict of interest.
Health and Welfare Benefits
The named executive officers are eligible for the same health and welfare benefits generally available to Huron employees.
Deferred Compensation Plan
The Company also offers a nonqualified deferred compensation plan (the
“DCP”"DCP") to all
principals, managing directors, corporate vice presidents, named executive officers and
non-employee directors. The DCP allows participants to elect to defer up to 75% of their base salary and 100% of their annual cash incentive into a deferred compensation account and to choose from a number of investment alternatives.
Non-employee directors may elect to defer up to 100% of their
board feescash compensation into the DCP. Earnings are credited based on the returns of the investment options selected by the participant. Any amounts contributed may be deferred until a later date or may become payable in connection with a
participant’sparticipant's retirement, death, disability or other separation from service.
Huron did not provide material perquisites
that are not provided widely withinover and above those commonly available to the broader Huron
employee population or similarly situated key management employees to any named executive officer in
2021.2023. The Company provides enhanced disability and life insurance benefits to all of its managing directors, corporate vice presidents and executive officers. Named executive officers and practice leaders are also offered reimbursement of the cost of an annual executive physical examination.
The Company’sCompany's incentive compensation recoupment policy (commonly referred to as a “clawback policy”"clawback policy") provides forwas amended and restated effective October 27, 2023 in accordance with Rule 10D-1 of the potentialSecurities Exchange Act of 1934 and NASDAQ listing standards.
The clawback policy requires the recoupment of
bonuses or awardsincentive-based compensation paid to executive officers and such other individuals designated by
our non-employee directors under our short-term and long-term incentive compensation plans, where the
payout or actual award received was determined basedpolicy in
part on the financial performance of the Company. In the event of a
material restatement of our quarterly or annual financial
results,results. In such an event, our
non-employee directors will review all
incentiveincentive-based compensation awarded to those individuals covered by the policy based upon the achievement of financial results that were the subject of the
restatement. The non-employee directors haverestatement and will recoup the
authority to recoup all or a portion of the incentiveincentive-based compensation to the extent
that the amount of such compensation would have been lower than the amount actually awarded, granted, paid, earned, deferred or vested based on the achievement of financial results that were subsequently reduced due to such restatement.
Stock Ownership Guidelines and Holding Requirements
The
We maintain stock ownership guidelines for
Huron’sHuron's named executive officers and
non-employee directors,
set forth below,which are consistent with
the practices of our peer
practicesgroup and
are designed to
promote alignment withalign the interests of
our stockholders,
directors and
the Company’s commitment to sound corporate governance. | | |
Position | | Stock Ownership Guideline |
CEO
| | 5x salary |
COO and CFO
| | 2x salary |
Other Executive Officers
| | 1x salary |
Non-employee Directors
| | 5x the annual retainer of $60,000 |
executive officers. Until the relevant stock ownership target is achieved, executive officers and non-employee directors are required to retain a number of shares equal to at least 60% of the net after tax proceeds from the exercise of stock options or vesting of restricted stock and performance units. Only shares owned outright count towards ownership requirements. Unexercised stock options and unvested performance units or unvested restricted stock do not count. Each of our NEOs and non-employee directors are in compliance with the terms of our share ownership guidelines, except that, as of the date of this Proxy Statement, Mr. Roth is not in compliance with his ownership requirement as a result of the decrease in the price of our stock during 2021. We anticipate Mr. Roth will be back in compliance with his ownership guideline during 2022.
guidelines.
| | | | | |
| Position | Stock Ownership Guideline |
| CEO | 5x salary |
| COO and CFO | 2x salary |
| Other Executive Officers | 1x salary |
| Non-employee Directors | 5x the annual retainer |
The Company has an insider trading policy that prohibits directors, officers, employees and contractors from entering into transactions in publicly tradedpublicly-traded puts, calls or other derivative securities with respect to Huron’s stock and prohibits any other transaction that “hedges”"hedges" the ownership in Huron’s stock or holding Company securities in a margin account or pledging Company securities as collateral for a loan.
Section 162(m).Section 162(m) of the Code generally disallows a tax deduction to public companies for compensation paid in excess of $1 million for any fiscal year to a company’s “covered employees”"covered employees". The Compensation Committee expects in the future to authorize compensation in excess of $1 million to employees that will not be deductible under Section 162(m) when it believes doing so is in the best interests of the Company and its shareholders.stockholders. The Company considers it important to retain the flexibility to design a compensation program that is in the best long-term interests of the Company and its shareholders,stockholders, even if certain payments under the program are not deductible under Section 162(m).
Section 280G. 280G.Section 280G of the Code disallows a company’s tax deduction for certain payments in connection with a change of control defined as “excess"excess parachute payments,”" and Section 4999 of the Code imposes a 20% excise tax on certain persons who receive excess parachute payments. The Senior Management Agreementssenior management agreements in effect ensure that any covered payments would be reduced to the extent necessary so that no portion of such payments is subject to the excise tax.COMPENSATION COMMITTEE REPORT
COMPENSATION COMMITTEE REPORT
The Compensation Committee has reviewed and discussed with management the information contained under the caption
“Compensation"Compensation Discussion and
Analysis”Analysis" and, based on this review and discussion, has recommended to the board of directors that it be included in this Proxy Statement and incorporated by reference into our
20212023 Annual Report on Form
10-K.Debra Zumwalt,
Joy T. Brown
H. Eugene Lockhart
Hugh E. Sawyer
Ekta Singh-Bushell
|
|
REQUIRED COMPENSATION DISCLOSURES |
Debra Zumwalt
2023 SUMMARY COMPENSATION TABLE | | | | | | | | | | | | | | | | | | | | | | | | | | |
| Name and Principal Position | Year | Salary ($) | Bonus ($) (1) | Non Equity Incentive Plan Compensation ($) | Stock Awards ($)(2)(3)(4) | All Other Compensation ($)(5) | Total Compensation ($) | |
C. Mark Hussey(6) President and Chief Executive Officer | 2023 | 919,792 | 430,000 | 1,676,563 | 2,642,725 | 37,323 | 5,706,403 | |
| 2022 | 800,000 | 430,000 | 1,104,000 | 1,643,228 | 38,603 | 4,015,831 | |
| 2021 | 800,000 | — | 800,000 | 840,005 | 35,394 | 2,475,399 | |
J. Ronald Dail(7)(8)(9) Executive Vice President and Chief Operating Officer | 2023 | 650,000 | — | 964,316 | 812,465 | 26,923 | 2,453,704 | |
| 2022 | 612,500 | — | 766,487 | 882,726 | 26,154 | 2,287,867 | |
| | | | | | | |
John D. Kelly Executive Vice President, Chief Financial Officer and Treasurer | 2023 | 572,917 | 205,000 | 833,750 | 1,322,087 | 29,956 | 2,963,710 | |
| 2022 | 525,000 | 205,000 | 652,050 | 1,029,306 | 29,034 | 2,440,390 | |
| 2021 | 525,000 | — | 472,500 | 472,463 | 26,977 | 1,496,940 | |
Ernest W. Torain, Jr. Executive Vice President, General Counsel and Corporate Secretary | 2023 | 447,917 | 80,000 | 489,375 | 692,411 | 34,516 | 1,744,219 | |
| 2022 | 398,333 | 80,000 | 276,000 | 516,327 | 33,486 | 1,304,146 | |
| 2021 | 360,000 | — | 180,000 | 194,414 | 31,024 | 765,438 | |
(1)The bonus amounts paid in 2022 and 2023 represent the first and second installments of the three-year cash retention awards, which were awarded in 2021 SUMMARY COMPENSATION TABLE | | | | | | | | | | | | | | | | | | | | | | | | | | | | | | | | | | | |
| Name and Principal Position | | Year | | Salary
($) | | Bonus
($)(1) | | Non Equity
Incentive Plan
Compensation
($) | | Stock
Awards
($)(2)(3) | | All Other
Compensation
($)(4) | | Total
Compensation
($) |
James H. Roth | | 2021 | | 950,000 | | | | — | | | | | 1,330,000 | | | | | 1,282,475 | | | | | 33,380 | | | | | 3,595,855 | |
Chief Executive Officer | | 2020 | | 947,917 | | | | 394,478 | | | | | 470,022 | | | | | 2,137,486 | | | | | 41,543 | | | | | 3,991,446 | |
| | 2019 | | 900,000 | | | | — | | | | | 1,285,614 | | | | | 2,024,994 | | | | | 32,954 | | | | | 4,243,562 | |
C. Mark Hussey | | 2021 | | 800,000 | | | | — | | | | | 800,000 | | | | | 840,005 | | | | | 35,394 | | | | | 2,475,399 | |
President and | | 2020 | | 797,917 | | | | 237,280 | | | | | 282,720 | | | | | 1,400,009 | | | | | 32,650 | | | | | 2,750,576 | |
Chief Operating Officer | | 2019 | | 750,000 | | | | — | | | | | 973,950 | | | | | 1,312,515 | | | | | 31,575 | | | | | 3,068,040 | |
John D. Kelly | | 2021 | | 525,000 | | | | — | | | | | 472,500 | | | | | 472,463 | | | | | 26,977 | | | | | 1,496,940 | |
Executive Vice President, | | 2020 | | 522,292 | | | | 140,144 | | | | | 166,982 | | | | | 1,537,500 | | | | | 26,677 | | | | | 2,393,595 | |
Chief Financial Officer and Treasurer | | 2019 | | 457,500 | | | | — | | | | | 418,149 | | | | | 690,001 | | | | | 25,473 | | | | | 1,591,123 | |
Ernest W. Torain, Jr.(5) | | 2021 | | 360,000 | | | | — | | | | | 180,000 | | | | | 194,414 | | | | | 31,024 | | | | | 765,438 | |
Executive Vice President, General Counsel and Corporate Secretary | | 2020 | | 285,000 | | | | 53,388 | | | | | 63,612 | | | | | 423,985 | | | | | 25,537 | | | | | 851,522 | |
(1) | The Bonus amounts awarded in 2020 represent discretionary awards approved by the Compensation Committee to align the NEO’s total payout, as a percentage of target, with the broader corporate bonus funding level.
|
(2) | to retain the NEOs continued leadership through the COVID-19 pandemic and in recognition of their exceptional performance during 2020.The final installment was paid in March 2024. (2)This column represents the aggregate grant date fair value of restricted stock and/or performance share unit awards. The value of the performance share units in the table is consistent with the estimate of aggregate compensation cost to be recognized over the service period determined as of the grant date under FASB ASC Topic 718. |
(3) | The stock awards granted in 2021 include the grant date fair value of restricted stock and/or performance share unit and/or performance-based stock option awards. The value of the performance share units and performance-based stock options in the table is consistent with the estimate of aggregate compensation cost to be recognized over the service period determined as of the grant date under FASB ASC Topic 718.
(3)The stock awards granted in 2022 and 2023 include the full value awarded under the 2022 and 2023 long-term incentive programs and performance share unit awards. The grant date fair value of the performance share unit awards represents one-third of the overall value awarded as performance share units under the 2021 long-term incentive program. The performance share unit awards included in the table above are to be earned based on performance against approved 2021 goals. As the 2022 and 2023 goals against which the second and third components of the award will be measured will be approved by the Compensation Committee in February 2022 and February 2023, respectively, these shares were not granted in 2021 as defined under FASB ASC Topic 718. |
(4) | All Other Compensation for 2021 is detailed in the table below.
|
(5) | Mr. Torain has served as Executive Vice President, General Counsel, and Secretary since March 1, 2020.
|
2021 long-term incentive program. The 2021 long-term incentive program retains a three-year cumulative performance cycle, but sets annual goals for both Adjusted Diluted EPS and Revenue Growth. Upon the Compensation Committee's approval of the 2022 and 2023 annual goals for the 2021 long-term incentive program, one-third of the overall value awarded in 2021 was deemed granted in February 2022 and February 2023 pursuant to FASB ASC Topic 718.
(4)The stock awards granted in 2021 include one-third of the overall value awarded as performance share units under the 2021 long-term incentive program as the Compensation Committee had not yet approved the 2022 and 2023 annual goals against which the second and third components of the award would be measured. The 2022 and 2023 annual goals were approved by the Compensation Committee in February 2022 and February 2023, respectively, at which time the shares were deemed granted pursuant to FASB ASC Topic 718.
(5)All Other Compensation | | | | | | | | | | | | | | | | | | | | | | | | | |
| Name | | Executive Long- Term Disability ($)(1) | | Executive $1MM
Term Life
Insurance ($)(2) | | Company Provided 401(k) Match ($)(3) | | Other Benefits and Perquisites
$(4) | | Total All
Other Compensation ($) |
James H. Roth | | | | 6,777 | | | | | 4,433 | | | | | 17,400 | | | | | 4,770 | | | | | 33,380 | |
C. Mark Hussey | | | | 7,101 | | | | | 5,648 | | | | | 17,400 | | | | | 5,245 | | | | | 35,394 | |
John D. Kelly | | | | 3,749 | | | | | 1,058 | | | | | 17,400 | | | | | 4,770 | | | | | 26,977 | |
Ernest W. Torain, Jr. | | | | 3,910 | | | | | 4,944 | | | | | 17,400 | | | | | 4,770 | | | | | 31,024 | |
(1) | Executive Long-Term Disability is provided to all executives and managing directors.
|
(2) | Executive Term Life Insurance is provided to all executives and managing directors.
|
(3) | Huron provides a Company 401(k) match to all participating employees.
|
(4) | Other Benefits and Perquisites include the cost of executive physicals, which Huron pays for executives and certain managing directors.
|
for 2023 is detailed in the table below. CEO Pay Ratio
As required(6)Mr. Hussey served as president and chief operating officer through June 30, 2022, at which time he was succeeded by Section 953(b)Mr. Dail effective July 1, 2022. Mr. Hussey continued to serve as president through December 31, 2022, and effective January 1, 2023, began serving as president and chief executive officer.
(7)Mr. Dail has served as executive vice president and chief operating officer since July 1, 2022, prior to which he led Huron’s healthcare performance improvement business unit.
(8)Mr. Dail's 2022 non-equity incentive plan compensation includes his earned non-equity incentive compensation under the NEO annual incentive plan and Healthcare Managing Director annual incentive plan, prorated for his time served as a managing director in the Healthcare business unit. Additionally, this total includes $122,837 earned under the Healthcare Managed Services incentive program, a commission-based program for the Healthcare Managed Services offering that is determined based on the revenue generated on certain engagements which Mr. Dail is eligible for based on his prior role as the leader of Huron's healthcare performance improvement business unit through July 1, 2022. Mr. Dail is eligible for this incentive compensation through 2026 as per the terms of the Dodd-Frank Wall Street ReformHealthcare Managed Services incentive program structure.
(9)Mr. Dail's 2023 non-equity incentive plan compensation includes his earned non-equity incentive compensation under the NEO annual incentive plan and Consumer Protection Act,$116,066 earned under the CompanyHealthcare Managed Services incentive program, a commission-based program for the Healthcare Managed Services offering that is providingdetermined based on the following disclosure aboutrevenue generated on certain engagements which Mr. Dail is eligible for based on his prior role as the relationshipleader of Huron's healthcare performance improvement business unit through July 1, 2022. Mr. Dail is eligible for this incentive compensation through 2026 as per the terms of the annual total compensationHealthcare Managed Services incentive program structure.
2023 All Other Compensation
| | | | | | | | | | | | | | | | | | | | |
| Name | Executive Long-Term Disability Insurance ($)(1) | Executive $1MM Term Life Insurance ($)(2) | Company Provided 401(k) Match ($)(3) | Other Benefits and Perquisites ($)(4) | Total All Other
Compensation
($) | |
| C. Mark Hussey | 7,101 | 4,087 | 19,800 | 6,335 | 37,323 | |
| J. Ronald Dail | 5,545 | 1,578 | 19,800 | — | 26,923 | |
| John D. Kelly | 4,353 | 1,033 | 19,800 | 4,770 | 29,956 | |
| Ernest W. Torain, Jr. | 7,136 | 2,726 | 19,800 | 4,854 | 34,516 | |
(1)Executive Long-Term Disability Insurance is provided to all executives, managing directors and principals.
(2)Executive Term Life Insurance is provided to all executives, managing directors and principals.
(3)Huron provides a Company 401(k) match to all participating employees.
(4)Other Benefits and Perquisites include the cost of our median-paid employee to the annual total compensation of Mr. Roth, our CEO. We believe that the pay ratio disclosed below is a reasonable estimate calculated in a manner consistent with Item 402(u) of Regulation S-K. SEC rulesexecutive physicals, which Huron pays for identifying the median employeeexecutives and calculating the pay ratio allow companies to apply various methodologies and apply various assumptions and, as a result, the pay ratio reported by us may not be comparable to the pay ratio reported by other companies.For 2021,
The annual total compensation of our median employee, was $146,370.
certain managing directors.Mr. Roth’s annual total compensation, as reflected in the Summary Compensation Table included in this Proxy Statement, was $3,595,855.
Based on this information, the ratio of the annual total compensation of Mr. Roth to the annual total compensation of our median employee is estimated to be 24.6 to 1.
2023 GRANTS OF PLAN-BASED AWARDSThe calculation of the 2021 CEO Pay Ratio used the same median employee as used in 2019 and 2020. As permitted by SEC rules, we used the same median employee that was identified in the preparation of our pay ratio in 2019 because there has been no change in our employee population or compensation arrangements that we believe would significantly impact our pay ratio disclosure. In 2019, we identified the median employee by examining the 2019 total compensation for all individuals using the same methodology we use for our NEOs as set forth in the 2019 Summary Compensation Table, excluding our CEO, who were employed by us on December 31, 2019. We included all employees, whether employed on a full-time or part-time basis. We annualized the base compensation and bonus for all employees that were not employed by us for all of 2019 unless they were designated as temporary or seasonal positions.
In addition, in order to identify our median employee in 2019, we (i) utilized the exemption permitted under Item 402(u) of Regulation S-K to exclude a total of 140 employees from Canada, the United Kingdom, Singapore, and Switzerland (which, in the aggregate, comprised less than 5% of our total employee population as of December 31, 2019), resulting in a net employee population of 3,811 and (ii) adjusted non-U.S. employee pay applying foreign currency exchange rates as of December 31, 2019.
When identifying the median employee for the 2019 Proxy Statement, we included all forms of compensation, including one-time, special and retention awards to identify our median employee. This resulted in identifying a median employee with compensation substantially similar to that of our median employee in the prior year.
We calculated 2021 annual total compensation for our median employee using the same methodology we use for our NEOs as set forth in the Summary Compensation Table.
2021 GRANTSOF PLAN-BASED AWARDS
The following table summarizes the grants of equity awards and annual cash incentive awards for 20212023 to each named executive officer.
| | | | | | | | | | | | | | | | | | | | | | | | | | | | | | | | | | | | | | | | | | | | | | | | | | | | | | | |
| | | | | | | Estimated Future Payouts Under
Non Equity Incentive Plan
Awards (1)(6) | | | | Estimated Future Payouts
Under Equity Incentive
Plan Awards (2) | | | | |
| Name | | Grant Date | | Date of Compensation Committee Action | | Threshold ($) | | Target ($) | | Maximum ($) | | | | Threshold (#) | | Target (#) | | Maximum (#) | | All Other Stock Awards: Number of Shares of Stock (#)(3) | | Full Grant Date Fair Value of Each Award ($)(4) |
James H. Roth | | | | 3/1/2021 | | | | | 2/18/2021 | | | | | — | | | | | — | | | | | — | | | | | | | | | | 1,988 | | | | | 7,953 | | | | | 15,906 | | | | | — | | | | | 427,474 | |
| | | | 3/1/2021 | | | | | 2/18/2021 | | | | | — | | | | | — | | | | | — | | | | | | | | | | — | | | | | — | | | | | — | | | | | 15,907 | | | | | 855,001 | |
| | | | | | | | | | | | | | 332,500 | | | | | 1,330,000 | | | | | 2,660,000 | | | | | | | | | | — | | | | | — | | | | | — | | | | | — | | | | | — | |
C. Mark Hussey | | | | 3/1/2021 | | | | | 2/18/2021 | | | | | — | | | | | — | | | | | — | | | | | | | | | | 1,302 | | | | | 5,209 | | | | | 10,418 | | | | | — | | | | | 279,984 | |
| | | | 3/1/2021 | | | | | 2/18/2021 | | | | | — | | | | | — | | | | | — | | | | | | | | | | — | | | | | — | | | | | — | | | | | 10,419 | | | | | 560,021 | |
| | | | | | | | | | | | | | 200,000 | | | | | 800,000 | | | | | 1,600,000 | | | | | | | | | | — | | | | | — | | | | | — | | | | | — | | | | | — | |
John D. Kelly | | | | 3/1/2021 | | | | | 2/18/2021 | | | | | — | | | | | — | | | | | — | | | | | | | | | | 733 | | | | | 2,930 | | | | | 5,860 | | | | | — | | | | | 157,488 | |
| | | | 3/1/2021 | | | | | 2/18/2021 | | | | | — | | | | | — | | | | | — | | | | | | | | | | — | | | | | — | | | | | — | | | | | 5,860 | | | | | 314,975 | |
| | | | | | | | | | | | | | 118,125 | | | | | 472,500 | | | | | 945,000 | | | | | | | | | | — | | | | | — | | | | | — | | | | | — | | | | | — | |
Ernest W. Torain, Jr. | | | | 3/1/2021 | | | | | 2/18/2021 | | | | | — | | | | | — | | | | | — | | | | | | | | | | 302 | | | | | 1,206 | | | | | 2,412 | | | | | — | | | | | 64,823 | |
| | | | 3/1/2021 | | | | | 2/18/2021 | | | | | — | | | | | — | | | | | — | | | | | | | | | | — | | | | | — | | | | | — | | | | | 2,411 | | | | | 129,591 | |
| | | | | | | | | | | | | | | 45,000 | | | | | 180,000 | | | | | 360,000 | | | | | | | | | | — | | | | | — | | | | | — | | | | | — | | | | | — | |
(1) | For the cash award, the target, threshold and maximum represent the range of cash award that could be earned. There is no payout if a threshold level of performance is not achieved. The minimum amount that could be paid is 25% of target and maximum represents 200% of target. Based on the achievement of specific financial goals, the Compensation Committee determined that 100% of the target award was earned for 2021.
|
(2) | The 2021 grant of PSUs
| | | | | | | | | | | | | | | | | | | | | | | | | | | | | | | | | | | | | | | | | | Estimated Future Payouts Under Non Equity Incentive Plan Awards | | Estimated Future Payouts Under Equity Incentive Plan Awards | | | | | Name | Grant
Date | Date of
Compensation
Committee
Action | Threshold
($) | Target
($) | Maximum
($) | | Threshold
(#) | Target
(#) | Maximum
(#) | All Other
Stock
Awards:
Number of
Shares of
Stock
(#) | Full Grant Date Fair Value of Each Award ($)(5) | | C. Mark
Hussey | 2/23/2023 | 2/23/2023 | — | — | — | | 586 | 5,210 | 11,462 | — | 561,498 | (2) | | 3/1/2023 | 2/23/2023 | — | — | — | | 4,467 | 17,867 | 35,734 | — | 1,456,875 | (3) | | 3/1/2023 | 2/23/2023 | — | — | — | | — | — | — | 7,657 | 624,352 | (4) | | | 144,531 | 1,156,250 | 2,312,500 | (1) | — | — | — | — | — | | J. Ronald
Dail | 3/1/2023 | 2/23/2023 | — | — | — | | 1,744 | 6,975 | 13,950 | — | 568,742 | (3) | | 3/1/2023 | 2/23/2023 | — | — | — | | — | — | — | 2,989 | 243,723 | (4) | | | 73,125 | 585,000 | 1,170,000 | (1) | — | — | — | — | — | |
| | | | | | | | | | | | | | | | | | | | | | | | | | | | | | | | | | | | | | | John D.
Kelly | 2/23/2023 | 2/23/2023 | — | — | — | | 330 | 2,931 | 6,448 | — | 315,883 | (2) | | 3/1/2023 | 2/23/2023 | — | — | — | | 2,160 | 8,638 | 17,276 | — | 704,343 | (3) | | 3/1/2023 | 2/23/2023 | — | — | — | | — | — | — | 3,702 | 301,861 | (4) | | | 71,875 | 575,000 | 1,150,000 | (1) | — | — | — | — | — | | Ernest W.
Torain, Jr. | 2/23/2023 | 2/23/2023 | — | — | — | | 136 | 1,205 | 2,651 | — | 129,867 | (2) | | 3/1/2023 | 2/23/2023 | — | — | — | | 1,207 | 4,829 | 9,658 | — | 393,756 | (3) | | 3/1/2023 | 2/23/2023 | — | — | — | | — | — | — | 2,070 | 168,788 | (4) | | | 42,188 | 337,500 | 675,000 | (1) | — | — | — | — | — | |
(1)The target, threshold and maximum represent the range of cash award that could be earned under the 2023 NEO annual incentive program. There is no payout if a threshold level of performance is not achieved for all financial or strategic measures. The minimum amount that could be paid is 12.5% of target, calculated as threshold payout of 50% for the lowest weighted component. Maximum payout represents 200% of target. Based on the achievement of specific financial goals and strategic measures, the Compensation Committee determined that 145% of the target award was earned for 2023. (2)The February 23, 2023 grant of performance stock units (PSUs) represents the third component of the full three-year long-term incentive award whose funding is based on 2021 performance as well the incorporation of performance against a cumulative three-year Revenue Growth goal. The PSUs could be earned at 25% of target for threshold performance up to 200% of target for maximum performance. If threshold performance is not achieved, the award will be forfeited. The 2022 and 2023 components of the 2021 long-term incentive award will be granted in March 2022 and March 2023, respectively when the annual goals are approved by the Compensation Committee. Final payout for all three components of the 2021 long-term incentive program will be determined at the end of the full three-year period and incorporate our performance against Compensation Committee-approved three-year Revenue Growth goals. Any earned PSUs will vest on March 1, 2024. |
(3) | Restricted stock granted under the Company’s 2012 Omnibus Incentive Plan.
|
(4) | The full grant date fair value of the March 1, 2021 restricted stock and PSU grants are based on the closing price of Huron stock of $53.75 on March 1, 2021. The total number of PSUs earned by recipients of these awards is contingent on meeting Adjusted Diluted EPS and Revenue Growth goals as described in Note (2) above.
|
2021 OUTSTANDING EQUITY AWARDSlong-term incentive award that is funded based on performance during the 2021-2023 performance cycle. The funding of this third component is based on 2023 annual performance against predefined financial measures of Adjusted Diluted EPS and Revenue Growth, as well as the performance against a cumulative three-year Revenue Growth measure. The minimum amount that could be earned is 11.25% of target, calculated as threshold payout of 25% on only one of the annual financial measures multiplied by the threshold multiplier of 0.9x for threshold performance on the three-year Revenue Growth measure. Maximum payout represents 220% of target, calculated as maximum payout of 200% on all financial measures multiplied by the maximum multiplier of 1.1x for maximum payout on the three-year Revenue Growth measure.
Based on the achievement of the specific annual and three-year measures for all three components of the 2021 long-term incentive award, the Compensation Committee determined that 194% of the entire target award was earned and vested on March 1, 2024. These PSUs were granted under the Company's 2012 Omnibus Incentive Plan.
(3)The March 1, 2023 grant of PSUs is based on the performance against predefined financial measures of Adjusted Diluted EPS and Revenue Growth over the three-year performance cycle from 2022-2024. The minimum amount that could be earned is 25% of target, calculated as threshold payout of 50% on only one of the financial measures; and, if threshold performance is not achieved for all financial measures, the award will be forfeited. The PSUs can be earned up to 200% of target for maximum performance on all financial measures. The PSUs that are earned will vest on March 1, 2025. These PSUs were granted under the Company's 2012 Omnibus Incentive Plan.
(4)This grant of restricted stock units (RSUs) was made under the 2023 NEO long-term incentive program and includes a three-year annual vesting period. The restricted stock was granted under the Company’s 2012 Omnibus Incentive Plan.
(5)The full grant date fair value of all RSU and PSU grants are based on the closing price of Huron stock on the date of grant, which was $70.44 and $81.54 on February 23, 2023 and March 1, 2023, respectively; and for performance-based awards, the estimate of expected funding as of the grant date. As of the grant date, the PSUs granted under the 2021 and 2023 NEO long-term incentive programs were estimated to be earned at 153% and target, respectively. The total number of PSUs to be earned is contingent on meeting specific financial targets as described in Notes 2 and 3 above.
2023 OUTSTANDING EQUITY AWARDS AT
FISCAL YEAR-END FISCAL YEAR-END
The following table sets forth certain information concerning outstanding stock and option awards as of December 31,
20212023 for each named executive officer. Market value is based on the closing price of Huron stock of
$49.90$102.80 on December
31, 2021,29, 2023, the last trading day of the fiscal year.
| | | | | | | | | | | | | | | | | | | | | | | | | | | | | | | | | | | | | | | | | | | | | | | | | | |
| | | | | Option Awards | | | | Stock Awards |
| Name | | Grant Date | | Number of Securities Underlying Unexercised Options (#) Exercisable | | Number of Securities Underlying Unexercised Options (#) Unexercisable | | Option Exercise Price
($) | | Option Expiration Date | | | | Number of Shares or Units of
Stock that
Have Not Vested (#) | | Market Value of Shares or
Units of Stock that
Have Not
Vested ($) | | Equity Incentive
Plan Awards:
Number of
Unearned Shares,
Units or Other
Rights that Have
Not Yet Vested
(#) | | Equity Incentive Plan
Awards: Market or
Payout Value of
Unearned Shares, Units
or Other Rights that
Have Not Yet Vested ($) |
James H. Roth | | | | 3/1/2012 | | | | | 4,661 | | | | | — | | | | | 38.18 | | | | | 3/1/2022 | | | | | | | | | | — | | | | | — | | | | | — | | | | | — | |
| | | | 3/1/2013 | | | | | 24,054 | | | | | — | | | | | 39.19 | | | | | 3/1/2023 | | | | | | | | | | — | | | | | — | | | | | — | | | | | — | |
| | | | 3/1/2019 | | | | | — | | | | | — | | | | | — | | | | | — | | | | | | | | | | 4,225 | (1) | | | | 210,828 | | | | | — | | | | | — | |
| | | | 3/1/2019 | | | | | — | | | | | — | | | | | — | | | | | — | | | | | | | | | | — | | | | | — | | | | | 29,574 | (2) | | | | 1,475,743 | |
| | | | 3/1/2020 | | | | | — | | | | | — | | | | | — | | | | | — | | | | | | | | | | 7,204 | (1) | | | | 359,480 | | | | | — | | | | | — | |
| | | | 3/1/2020 | | | | | — | | | | | — | | | | | — | | | | | — | | | | | | | | | | — | | | | | — | | | | | 25,215 | (3) | | | | 1,258,229 | |
| | | | 3/1/2021 | | | | | — | | | | | — | | | | | — | | | | | — | | | | | | | | | | 15,907 | (1) | | | | 793,759 | | | | | — | | | | | — | |
| | | | | 3/1/2021 | | | | | — | | | | | — | | | | | — | | | | | — | | | | | | | | | | — | | | | | — | | | | | 7,953 | (4) | | | | 396,855 | |
C. Mark Hussey | | | | 3/1/2012 | | | | | 6,144 | | | | | — | | | | | 38.18 | | | | | 3/1/2022 | | | | | | | | | | — | | | | | — | | | | | — | | | | | — | |
| | | | 3/1/2013 | | | | | 7,731 | | | | | — | | | | | 39.19 | | | | | 3/1/2023 | | | | | | | | | | — | | | | | — | | | | | — | | | | | — | |
| | | | 3/1/2019 | | | | | — | | | | | — | | | | | — | | | | | — | | | | | | | | | | 2,739 | (1) | | | | 136,676 | | | | | — | | | | | — | |
| | | | 3/1/2019 | | | | | — | | | | | — | | | | | — | | | | | — | | | | | | | | | | — | | | | | — | | | | | 19,169 | (2) | | | | 956,533 | |
| | | | 3/1/2020 | | | | | — | | | | | — | | | | | — | | | | | — | | | | | | | | | | 4,719 | (1) | | | | 235,478 | | | | | — | | | | | — | |
| | | | 3/1/2020 | | | | | — | | | | | — | | | | | — | | | | | — | | | | | | | | | | — | | | | | — | | | | | 16,515 | (3) | | | | 824,099 | |
| | | | 3/1/2021 | | | | | — | | | | | — | | | | | — | | | | | — | | | | | | | | | | 10,419 | (1) | | | | 519,908 | | | | | — | | | | | — | |
| | | | | 3/1/2021 | | | | | — | | | | | — | | | | | — | | | | | — | | | | | | | | | | — | | | | | — | | | | | 5,209 | (4) | | | | 259,929 | |
John D. Kelly | | | | 3/1/2019 | | | | | — | | | | | — | | | | | — | | | | | — | | | | | | | | | | 1,440 | (1) | | | | 71,856 | | | | | — | | | | | — | |
| | | | 3/1/2019 | | | | | — | | | | | — | | | | | — | | | | | — | | | | | | | | | | — | | | | | — | | | | | 10,077 | (2) | | | | 502,842 | |
| | | | 3/1/2020 | | | | | — | | | | | — | | | | | — | | | | | — | | | | | | | | | | 2,654 | (1) | | | | 132,435 | | | | | — | | | | | — | |
| | | | 3/1/2020 | | | | | — | | | | | — | | | | | — | | | | | — | | | | | | | | | | 12,639 | (5) | | | | 630,686 | | | | | — | | | | | — | |
| | | | 3/1/2020 | | | | | — | | | | | — | | | | | — | | | | | — | | | | | | | | | | — | | | | | — | | | | | 9,290 | (3) | | | | 463,571 | |
| | | | 3/1/2021 | | | | | — | | | | | — | | | | | — | | | | | — | | | | | | | | | | 5,860 | (1) | | | | 292,414 | | | | | — | | | | | — | |
| | | | | 3/1/2021 | | | | | — | | | | | — | | | | | — | | | | | — | | | | | | | | | | — | | | | | — | | | | | 2,930 | (4) | | | | 146,207 | |
Ernest W. Torain, Jr. | | | | 4/1/2020 | | | | | — | | | | | — | | | | | — | | | | | — | | | | | | | | | | 1,492 | (1) | | | | 74,451 | | | | | — | | | | | — | |
| | | | 4/1/2020 | | | | | — | | | | | — | | | | | — | | | | | — | | | | | | | | | | 1,534 | (1) | | | | 76,547 | | | | | — | | | | | — | |
| | | | 4/1/2020 | | | | | — | | | | | — | | | | | — | | | | | — | | | | | | | | | | — | | | | | — | | | | | 5,220 | (3) | | | | 260,478 | |
| | | | 3/1/2021 | | | | | — | | | | | — | | | | | — | | | | | — | | | | | | | | | | 2,411 | (1) | | | | 120,309 | | | | | — | | | | | — | |
| | | | | 3/1/2021 | | | | | — | | | | | — | | | | | — | | | | | — | | | | | | | | | | — | | | | | — | | | | | 1,206 | (4) | | | | 60,179 | |
| (1) | | | | | | | | | | | | | | | | | | | | | | | | | | | | | | | | | | |
| | Option Awards | | Consists
Stock Awards | |
| Name | Grant
Date | Number of unvested restricted stock as
Securities
Underlying
Unexercised
Options (#)
Exercisable | Number of December 31, 2021
Securities
Underlying
Unexercised
Options (#)
Unexercisable | Option
Exercise
Price
($) | Option
Expiration
Date | | Number of
Shares or
Units of Stock
that vests 33% annually over three years from the dateHave Not
Vested
(#) | Market Value
of grant provided the individual is still employed by Huron on the applicable vesting dateShares or is eligible for retirement under the Company’s equity incentive plan.Units of
Stock that Have Not Vested
($) | Equity Incentive Plan Awards: Number of Unearned Shares, Units or Other Rights that Have Not Yet Vested
(#) | Equity Incentive Plan Awards: Market or Payout Value of Unearned Shares, Units or Other Rights that Have Not Yet Vested
($) | |
(2)C. Mark Hussey | Consists of the 2019 grant of PSUs that vest based on performance for the 2019-2021 performance period. Actual payouts may range from 0% to 200% of target with 25% paid for threshold performance. The amount reflected in the table equals the target amount. The actual amount earned was 73% of target and 100% of the earned amount vested on March 1, 2022.
3/1/2021 | — | — | — | — | | 3,474 (1) | 357,127 | — | — | |
(3)3/1/2021 | Consists of the 2020 grant of PSUs that vest based on performance for the 2020-2022 performance period. Actual payouts may range from 0% to 200% of target with 25% paid for threshold performance. The amount reflected in the table equals the target amount. Once the 2020-2022 performance period is complete, 100% of the earned award vests on March 1, 2023.
— | — | — | — | | 30,318 (3) | 3,116,723 | — | — | |
(4)3/1/2022 | Consists of the 2021 grant of PSUs that vest based on performance for the 2021 annual period as well as performance against a cumulative three-year Revenue Growth goal for the 2021-2023 performance period. Actual payouts may range from 0% to 200% of target with 25% paid for threshold performance. The amount reflected in the table equals the target amount of the 2021 component. The 2022 and 2023 component will be granted in March 2022 and March 2023, respectively. Once the 2021-2023 performance period is complete, 100% of the earned award vests on March 1, 2024.
— | — | — | — | | 5,807 (2) | 596,960 | — | — | |
(5)3/1/2022 | Consists of unvested restricted stock as of December 31, —
| — | — | — | | — | — | 40,648 (4) | 4,178,614 | |
| 3/1/2023 | — | — | — | — | | 7,657 (2) | 787,140 | — | — | |
| 3/1/2023 | — | — | — | — | | — | — | 17,867 (5) | 1,836,728 | |
| J. Ronald Dail | 3/1/2020 | — | — | — | — | | 1,608 (6) | 165,302 | — | — | |
3/1/2021 that will vest 100% four years from the date of grant provided the individual is still employed by Huron on the applicable vesting date. | — | — | — | — | | 1,654 (6) | 170,031 | — | — | |
| 3/1/2022 | — | — | — | — | | 3,971 (6) | 408,219 | — | — | |
| 3/1/2022 | — | — | — | — | | 2,593 (7) | 266,560 | — | — | |
| 3/1/2022 | 1,226 (7) | 2,451 (7) | 48.22 | 3/1/2029 | | — | — | — | — | |
| 7/1/2022 | — | — | — | — | | 1,233 (2) | 126,752 | — | — | |
| 7/1/2022 | — | — | — | — | | — | — | 15,332 (4) | 1,576,130 | |
| 3/1/2023 | — | — | — | — | | 1,576 (6) | 162,013 | — | — | |
| 3/1/2023 | — | — | — | — | | 2,989 (2) | 307,269 | — | — | |
| 3/1/2023 | — | — | — | — | | — | — | 6,975 (5) | 717,030 | |
John D.
Kelly | 3/1/2020 | — | — | — | — | | 12,639 (8) | 1,299,289 | — | — | |
| 3/1/2021 | — | — | — | — | | 1,954 (1) | 200,871 | — | — | |
| 3/1/2021 | — | — | — | — | | 17,055 (3) | 1,753,207 | — | — | |
| 3/1/2022 | — | — | — | — | | 3,703 (2) | 380,668 | — | — | |
| 3/1/2022 | — | — | — | — | | — | — | 25,912 (4) | 2,663,754 | |
| 3/1/2023 | | | | | | 3,702 (2) | 380,566 | — | — | |
| 3/1/2023 | — | — | — | — | | — | — | 8,638 (5) | 887,986 | |
| Ernest W. Torain, Jr. | 3/1/2021 | — | — | — | — | | 804 (1) | 82,651 | — | — | |
| 3/1/2021 | — | — | — | — | | 7,017 (3) | 721,346 | — | — | |
| 3/1/2022 | — | — | — | — | | 1,909 (2) | 196,245 | — | — | |
| 3/1/2022 | — | — | — | — | | — | — | 13,356 (4) | 1,372,997 | |
| 3/1/2023 | — | — | — | — | | 2,070 (2) | 212,796 | — | — | |
| 3/1/2023 | — | — | — | — | | — | — | 4,829 (5) | 496,421 | |
(1)Consists of unvested restricted stock awards as of December 31, 2023 that vests 33% annually over three years from the date of grant provided the individual is still employed by Huron on the applicable vesting date or is eligible for retirement under the Company's equity incentive plan.
(2)Consists of unvested restricted stock units as of December 31, 2023 that vests 33% annually over three years from the date of grant, provided that the individual is still employed by Huron on the applicable vesting date or is eligible for retirement under the Company's equity incentive plan.
(3)Consists of the 2021 OPTION EXERCISESgrant of PSUs that vest based on performance for the 2021-2023 performance period. The amount reflected in the table equals 194%, the actual amount earned. The earned amount vested on March 1, 2024.
(4)Consists of the 2022 grant of PSUs that vest based on performance for the 2022-2024 performance period. Actual payouts may range from 0% to 200% of target, with 12.5% paid for threshold performance. As of December 31, 2023, it was estimated that the award would be earned at an amount between target and maximum; as such, the amount reflected in the table equals the maximum amount. Once the 2022-2024 performance period is complete, the earned award will vest in its entirety on March 1, 2025.
(5)Consists of the 2023 grant of PSUs that vest based on performance for the 2023-2025 performance period. Actual payouts may range from 0% to 200% of target, with 25% paid for threshold performance. The amount reflected in the table equals the target amount based on the estimated funding as of December 31, 2023. Once the 2023-2025 performance period is complete, the earned award will vest in its entirety on March 1, 2026.
(6)Consists of unvested restricted stock as of December 31, 2023 that vests 25% annually over four years from the date of grant, provided that the individual is still employed by Huron on the applicable vesting date or is eligible for retirement under the Company's equity incentive plan.
(7)Consists of the unvested PSUs and unexercised performance stock options (PSOs) granted in 2022 that were earned based on the 2022 annual performance of the Healthcare business unit. The amount reflected in the table equals the unvested PSUs and unexercised PSOs of the earned amount. The earned awards vest 33% annually over three years from the date of grant provided the individual is still employed by Huron on the applicable vesting date.
(8)Consists of unvested restricted stock as of December 31, 2023 that will vest 100% four years from the date of grant, provided that the individual is still employed by Huron on the applicable vesting date.
2023 OPTION EXERCISES AND
STOCK VESTED STOCK VESTED
The following table sets forth certain information concerning stock
option exercisesoptions exercised and restricted stock vested during
20212023 for each named executive officer.
| | | | | | | | | | | | | | | | | | | | | | | | | |
| | | Option Exercises | | | | Stock Awards |
| Name | | Shares Acquired
on Exercise (#) | | Value Realized
on Exercise ($)(1) | | | | Shares Acquired
on Vesting (#) | | Value Realized
on Vesting ($)(2) |
James H. Roth | | | | 21,631 | | | | | 348,071 | | | | | | | | | | 70,176 | | | | | 3,571,958 | |
C. Mark Hussey | | | | 1,772 | | | | | 40,100 | | | | | | | | | | 43,419 | | | | | 2,201,933 | |
John D. Kelly | | | | — | | | | | — | | | | | | | | | | 13,963 | | | | | 710,717 | |
Ernest W. Torain, Jr. | | | | — | | | | | — | | | | | | | | | | 1,512 | | | | | 76,175 | |
(1) | The value realized on exercise equals the market value of Huron stock measured at the time of exercise minus the exercise price of the options multiplied by the number of options exercised.
|
(2) | The value realized on vesting equals the market value of Huron stock measured as the closing price of the stock on the most recent business day preceding the vesting date multiplied by the number of shares received on vesting.
|
2021 NONQUALIFIED DEFERRED COMPENSATION
| | | | | | | | | | | | | | | | | | | | |
| Option Exercises | | Stock Awards | |
| Name | Shares Acquired
on Exercise
(#) | Value Realized
on Exercise
($) | | Shares Acquired
on Vesting
(#) | Value Realized on Vesting ($)(1) | |
| C. Mark Hussey | — | — | | 11,874 | 833,436 | |
| J. Ronald Dail | — | — | | 6,816 | 478,415 | |
| John D. Kelly | — | — | | 6,895 | 483,960 | |
| Ernest W. Torain, Jr. | — | — | | 4,262 | 314,552 | |
(1)The value realized on vesting equals the number of shares received on vesting multiplied by the closing price of Huron stock on the most recent business day preceding the vesting date.
2023 NONQUALIFIED DEFERRED COMPENSATION
The following table sets forth the deferred compensation activity for the named executive officers in
2021. | | | | | | | | | | | | | | | | | | | | | | | | | |
| Name | | Executive
Contributions
in 2021 ($)(1) | | Company
Contributions
in 2021 ($) | | Aggregate
Earnings/
Losses
in 2021 ($) | | Aggregate
Withdrawals/
Distributions
in 2021 ($) | | Aggregate
Balance as of 12/31/21 ($) |
James H. Roth | | | | — | | | | | — | | | | | 346,076 | | | | | — | | | | | 4,036,073 | |
C. Mark Hussey | | | | — | | | | | — | | | | | 324,985 | | | | | — | | | | | 1,837,422 | |
John D. Kelly | | | | — | | | | | — | | | | | — | | | | | — | | | | | — | |
Ernest W. Torain, Jr. | | | | — | | | | | — | | | | | — | | | | | — | | | | | — | |
(1) | There were no executive contributions made to the DCP for 2021.
|
2023.
| | | | | | | | | | | | | | | | | | | | |
| Name | Executive Contributions in 2023 ($)(1) | Company
Contributions
in 2023
($) | Aggregate
Earnings/Losses
in 2023
($) | Aggregate
Withdrawals/
Distributions
in 2023
($) | Aggregate
Balance as of
12/31/23
($) | |
| C. Mark Hussey | — | — | 220,165 | — | 1,752,287 | |
| J. Ronald Dail | — | — | — | — | — | |
| John D. Kelly | — | — | — | — | — | |
| Ernest W. Torain, Jr. | — | — | — | — | — | |
(1)There were no executive contributions made to the deferred compensation plan for 2023.
The Company maintains the
DCP,deferred compensation plan (the "DCP"), which became effective July 1,
2006. The DCP permits2006, for principals, managing directors, corporate vice presidents,
and named executive officers
to electand members of the board of directors. The DCP permits eligible employees to defer up to 75% of their base salary and 100% of their annual cash incentive
into a deferred compensation account and
permits directors to defer up to 100% of their cash compensation. Participants are able to choose from a number of investment alternatives. Earnings are credited based on the returns of the investment options selected by the participant. Huron does not match any amounts deferred or otherwise contribute to the DCP except to make restoration payments to the accounts of participants who do not receive the maximum eligible 401(k) match as a result of participation in the DCP. Deferral elections for base salary and any guaranteed bonus must be made in the calendar year prior to earning such base salary or within 30 days of becoming eligible for the plan. The Company requires that deferral elections of the annual cash incentive must be made 12 months prior to the end of the applicable performance period.
Non-employee directors may also defer up to 100% of their retainer and meeting fees into the DCP.Payments from the plan automatically begin upon termination of employment or separation from service as a director. Key employees, including executive officers, must wait six months after termination to receive payment from the plan. Participants may elect payment in a lump sum or annual installments for up to 15 years. Upon proof of financial hardship and approval from the Compensation Committee, a participant may be allowed an early distribution. Participants may also elect to receive payments prior to termination through a scheduled distribution.
|
POTENTIAL PAYMENTS UPON TERMINATION OR CHANGE OF CONTROL
|
POTENTIAL PAYMENTS UPON TERMINATION OR CHANGE OF CONTROL
We have entered into agreements and maintain plans and arrangements that require us to pay or provide compensation and benefits to each of the named executive officers in the event of certain terminations of employment or a change of control.
Senior Management Agreements
Mr.
Roth’sHussey's senior management agreement
covers a term beginning onas chief executive officer, effective January 1,
2017 and2023, continues for three years from
thatthe effective date. Following the expiration of
thatthe initial three-year term,
histhe agreement
waswill be automatically renewed
and will continue to automatically renew every
year,twelve months unless Mr.
RothHussey or the Company provides 60
days’days' advance written notice
toof the
other thatcessation of such automatic
renewal shall cease.renewal. The agreement may be earlier terminated by Mr.
RothHussey or the Company pursuant to its terms.
Mr.
Hussey,Dail, Mr. Kelly and Mr.
Torain’sTorain's senior management agreements provide that employment will continue unless either the Company or the executive delivers to the other 60 days’ advance written notice of the cessation of employment. These may be earlier terminated by the executive or the Company pursuant to their terms.
The following table summarizes how unvested equity awards will be addressed in the event of a termination under the
Senior Management Agreementssenior management agreements that were in effect during
2021.2023. | | | | | | | | |
| Event | | Restricted Stock and Options | | 2019, 20202021, 2022 and 2021
2023 Performance Stock Units |
| Normal Vesting | | 33% annual vesting over 3 years for awards granted on or after 3/15/2017;years; 100% vesting after 4 years for the supplemental award granted to John D. Kelly on 3/1/2020. | | 100% of the earned PSUs vest in Q1 of the year following the end of the three year Performance Period provided that executive remains employed at Huron through the Performance Period.performance period. |
| Voluntary Termination | Forfeit. | Forfeit. | | Forfeit. |
Termination for “Cause”"Cause" | Forfeit. | Forfeit. | | Forfeit. |
| Approved Retirement (comply with non-compete provisions) | | Subject to non-compete, vesting continues per normal course post-retirement. | | Earned based on actual performance and will vest pro rata on March 1 of the year following the three year Performance Periodperformance period based on number of days employed during the Performance Period.performance period. Subject to non-compete, vesting continues per normal course post-retirement. |
| Death or Disability | | Full acceleration. | | Earned based on actual performance and will vest pro rata on March 1 of the year following the three year Performance Periodperformance period based on number of days employed during the Performance Period. |
| | | | performance period. |
Event | | Restricted Stock and Options | | 2019, 2020 and 2021
Performance Stock Units |
Involuntary/Good
Reason Termination | Forfeit. | Forfeit. | | Earned based on actual performance and will vest pro rata on March 1 of the year following the three year Performance Periodperformance period based on number of days employed during the performance period. |
| | | | | | | | |
| Event | Restricted Stock and Options | 2021, 2022 and 2023 Performance Period.Stock Units |
Change of Control (“COC”
("COC"), No Termination | | No impact, assumed by acquirer. | | If assumed by acquirer and converts shares into right to receive equivalent value shares in new entity then vesting continues per normal course.
If not assumed by acquirer or acquirer does not convert shares into right to receive equivalent value in shares of new entity and the COC occurs during the performance period, then the PSUs will vest at target (or, with respect to the 2021 PSUs, the greater of target or the level dictated by actual performance at the time of the COC (and with respect to the 2021 PSUs, without adjustment for the multiplier based on Revenue Growth) if.
If not assumed by acquirer or acquirer does not convert shares into a right to receive equivalent value in shares of the new entity and the COC occurs duringafter the performance period, orthen the PSUs will vest at the level dictated by actual performance (or, with respect to the 2021 PSUs, the greater of target or the level dictated by actual performance at the time of the COC) if the COC occurs after the performance period and oneCOC.
One share of Company common stock will be exchanged for each PSU and such common stock will receive the consideration paid by the acquirer in the COC.
|
Involuntary/Good Reason
Termination Post-COC | | Full acceleration. | | Shares shall immediately fully vest (atat the greater of target or level dictated by actual performance (with respect to the 2021 PSUs actual performance will be determined without adjustment for the multiplier based on Revenue Growth)). |
The treatment of unvested equity awards granted to Mr. Hussey in the event of termination did not change with the execution of his senior management agreement as a chief executive officer, which was effective January 1, 2023. The terms and conditions of each equity award are subject to the terms of the applicable equity inventive plan of the Company and the equity awards' grant agreements.
Mr. Hussey,
Mr. Dail, Mr. Kelly and Mr. Torain
will beare eligible to participate in the Company’s various health and welfare benefit plans for its similarly situated key management employees.
Restrictive Covenants on Termination
For the applicable restricted period set forth in eachthe senior management agreements of all executive officer’s Senior Management Agreement, heofficers, except for Mr. Dail, such executive officers may not directly or indirectly (i) hire any employees of the Company or solicit, induce or encourage any employee of the Company or any client of the Company to leave, alter or cease hishis/her/its relationship with itthe Company or (ii) provide services that are the same as or similar to those offered by the Company to any client of the Company that he obtained as a client for the Company, to whom he provided services within the 12 months preceding termination of employment, or to whom he submitted a proposal during the six months prior to termination of employment. The restricted period for Mr. RothHussey is 12 to 24 months (depending on the type of termination) following termination of employment. The restricted period for Mr. Hussey, Mr. Kelly and Mr. Torain is 12 months following termination of employment for any reason.
In addition, for a period of 12 to 24 months (depending on the type of termination) following the termination of his employment, Mr. RothHussey may not, directly or indirectly, provide services that are competitive with those of the Company to any person, firm or other business entity. Executives
Under Mr. Dail's senior management agreement, during his employment with the Company he may not directly or indirectly solicit, induce or encourage any employee of the Company or any client or other business relation to leave, alter or cease his/her/its relationship with the Company. In addition, for a period of 12 months following termination of his employment with the Company, he may not interfere with the Company's business relationship with a Company employee.
All executives are also subject to a confidentiality and
non-disclosure covenant.
Definition of
“Change"Change of
Control”Control"
A Change of Control is defined in each of
Mr. Roth, Mr. Hussey, Mr. Kelly and Mr. Torain’s Senior Management Agreementsthe executive's senior management agreements as:
•any person becomes a beneficial owner of 40% or more of the Company’s outstanding securities;
•there is a consummation of a merger or consolidation with any person unless (a) the voting securities of the Company outstanding immediately prior to the transaction continue to represent at least 50% of the combined voting power of the securities of the Company or such other surviving entity; (b) the merger is a recapitalization in which no person other than existing security holders becomes a beneficial owner representing 50% or more of the Company’s then outstanding securities; or (c) the merger does not represent a sale of all or substantially all of the Company’s assets;
•the stockholders approve a plan of complete liquidation or dissolution; or
•there is a disposition or sale of all or substantially all of the Company’s assets other than a sale or disposition in which at least 50% of the combined voting power of the voting securities are owned by shareholdersstockholders of Huron.
Definition of
“Good Reason”"Good Reason"
The definition of
“Good Reason”"Good Reason" is defined under
all of the
Senior Management Agreementssenior management agreements to mean a resignation following: (i)
a change in primary location of employment to a location that is more than 50 miles from Chicago, Illinois; (ii) a failure to comply with any material term of the agreement by the
Company or (iii)Company; (ii) a material reduction in base salary or benefits coverage, provided that such reduction is without his or her consent, is not warranted by the Company’s financial condition, and is not a change that applies uniformly to similarly situated Company
executives.executives; or in the case of the senior management agreements for Mr. Hussey, Mr. Kelly and Mr. Torain (iii) a change in primary location of employment to a location that is more than 50 miles from Chicago, Illinois. The
senior management agreements provide the Company the right to cure prior to a senior executive’s resignation for Good Reason.
Definition of
“Good Reason”"Good Reason" in Relation to a Change of Control
Under each of
Mr. Roth, Mr. Hussey, Mr. Kelly and Mr. Torain’s Senior Management Agreements,the executive's senior management agreements, a Change of Control Good Reason occurs if certain adverse changes occur in anticipation of, or within
twenty-four24 months following, a Change of Control including:
| (a) | any material breach of the Senior Management Agreement by the Company,
|
| (b) | any material adverse change in the executive’s status, responsibilities or position with the Company,
|
| (c) | any material reduction in his base salary or target bonus, other than in connection with an across-the-board reduction in base salaries applicable in like proportions to all similarly situated executives of the Company and any direct or indirect parent of the Company,
|
| (d) | assignment of duties to the executive that are materially inconsistent with his position and responsibilities described in the Senior Management Agreement, including, specifically, assignment of a position other than as Chief Executive Officer of the surviving Company in the case of Mr. Roth, or
|
| (e) | requiring the executive to be principally based at any office or location that is greater than 50 miles from Chicago, Illinois.
|
(a)any material breach of the senior management agreement by the Company;
(b)any material adverse change in the executive’s status, responsibilities or position with the Company;
(c)any material reduction in his base salary or target bonus, other than in connection with an across-the-board reduction in base salaries applicable in like proportions to all similarly situated executives of the Company and any direct or indirect parent of the Company;
(d)assignment of duties to the executive that are materially inconsistent with his position and responsibilities described in the senior management agreement, including, specifically, assignment of a position other than as chief executive officer of the surviving Company in the case of Mr. Hussey; or
(e)requiring the executive to be principally based at any office or location that is greater than 50 miles from Chicago, Illinois.
Termination without Cause or Resignation for Good Reason
If any of the
NEOsexecutives is terminated without Cause or resigns for Good Reason, as defined in his
Senior Management Agreement,senior management agreement, upon executing a general release and waiver, the Company is obligated to pay severance and continuation of benefits in varying amounts. In addition,
NEOsexecutives will receive pro rata vesting of performance stock units that would otherwise have been earned in the performance period.
The following severance benefits are payable to each of our named executive officers upon termination without Cause or resignation for Good Reason, except in the case of a Change of Control, as of December 31,
2021:2023: | | | | | |
| Executive | | Severance Benefits |
ExecutiveC. Mark Hussey | | Severance Benefits |
James H. Roth
| | An amount in cash equal to two times the sum of his then current annual base salary and his then current target bonus; pro rata bonus in the year of termination based on actual results; 24 months’ continuation of medical insurance; and pro rata vesting of performance stock units that would otherwise have been earned in the performance period. Severance amounts are payable in a lump sum. |
C. Mark Hussey
J. Ronald Dail | | An amount in cash equal to one and one-half times the sum of his then current annual base salary and his then current target bonus; pro rata bonus in the year of termination based on actual results; 18 months’ continuation of medical insurance; and pro rata vesting of performance stock units that would otherwise have been earned in the performance period. Severance amounts are payable in a lump sum.
|
John D. Kelly
| | An amount in cash equal to the sum of his then current annual base salary and his then current target bonus; pro rata bonus in the year of termination based on actual results; 12 months’ continuation of medical insurance; and pro rata vesting of performance stock units that would otherwise have been earned in the performance period. Severance amounts are payable in a lump sum. |
| | | | | |
Ernest W. Torain, Jr.John D. Kelly | | An amount in cash equal to the sum of his then current annual base salary and his then current target bonus; pro rata bonus in the year of termination based on actual results; 12 months’ continuation of medical insurance; and pro rata vesting of performance stock units that would otherwise have been earned in the performance period. Severance amounts are payable in a lump sum. |
| Ernest W. Torain, Jr. | An amount in cash equal to the sum of his then current annual base salary and his then current target bonus; pro rata bonus in the year of termination based on actual results; 12 months’ continuation of medical insurance; and pro rata vesting of performance stock units that would otherwise have been earned in the performance period. Severance amounts are payable in a lump sum. |
In
Under all senior management agreements, in the event an executive qualifies for an approved retirement and signs a
non-compete agreement, he would receive continued vesting of his stock options and restricted stock. There would be no acceleration, but the equity would continue to vest per the schedule as outlined in the grant agreements.
Termination of Employment Due to Death or Disability
If
Under each of the senior management agreements, if any of our executives dies or becomes disabled, his estate will receive payment of base salary and a pro rata bonus at target through the date of termination. The executive and/or his eligible dependents shall receive continuation of medical benefits for six months. In addition, unvested time-based equity outstanding will vest and unvested performance-based awards will vest in accordance with the applicable
PSUgrant agreement.
Termination of Employment Due to Termination other than for Resignation for Good Reason or Due to Cause
No severance or benefits are paid if an executive officer is terminated for Cause or resigns other than for Good Reason as defined in the executive’s
Senior Management Agreement.senior management agreement.
Termination without Cause or Resignation for Good Reason Related to a Change of Control
If any of our executives with a Senior Management Agreement is terminated without Cause or resigns for Good Reason in conjunction with a Change of Control, as defined in his Senior Management Agreement,senior management agreement, upon executing a general release and waiver, the Company is obligated to pay severance and continuation of benefits in varying amounts.
The following severance benefits are payable to each of our named executive officers upon termination without Cause or resignation for Good Reason, in the case of a Change of Control, as of December 31, 2021:
2023: | | | | | |
| Executive | | Severance Benefits |
ExecutiveC. Mark Hussey | | Severance Benefits |
James H. Roth
| | An amount in cash equal to two and one-half times the sum of his then current annual base salary and his then current target bonus,bonus; pro rata target bonus in the year of termination,termination; 30 months’ continuation of medical insurance,insurance; and accelerated vesting of all outstanding equity grants that were awarded at or prior to the time of the Change of Control. Severance amounts are payable in a lump sum. |
C. Mark Hussey
J. Ronald Dail | | An amount in cash equal to twoone and one-half times the sum of his then current annual base salary and his then current target bonus,bonus; pro rata target bonus in the year of termination, 24termination; 18 months’ continuation of medical insurance,insurance; and accelerated vesting of all outstanding equity grants that were awarded at or prior to the time of the Change of Control. Severance amounts are payable in a lump sum. |
John D. Kelly | | An amount in cash equal to one and one-half times the sum of his then current annual base salary and his then current target bonus,bonus; pro rata target bonus in the year of termination,termination; 18 months’ continuation of medical insurance,insurance; and accelerated vesting of all outstanding equity grants that were awarded at or prior to the time of the Change of Control. Severance amounts are payable in a lump sum. |
| Ernest W. Torain, Jr. | | An amount in cash equal to one and one-half times the sum of his then current annual base salary and his then current target bonus,bonus; pro rata target bonus in the year of termination,termination; 18 months’ continuation of medical insurance,insurance; and accelerated vesting of all outstanding equity grants that were awarded at or prior to the time of the Change of Control. Severance amounts are payable in a lump sum. |
All four Senior Management Agreementsexecutive senior management agreements provide that, if any amount, right or benefit paid or payable to the executive under his Senior Management Agreementsenior management agreement or any other plan, program or arrangement would constitute an “excess"excess parachute payment”payment" under Section 280G of the Code, subject to the excise tax imposed by Section 4999 of the Code, then the amount of payments
payable to the executive under his
Senior Management Agreementsenior management agreement will be reduced to the extent necessary so that no portion of such payments is subject to such excise tax.
POTENTIAL PAYMENTSUPON TERMINATIONOR CHANGEOF CONTROL
Potential Payments Upon Termination or Change of Control
The estimated amount payable or provided to each named executive officer in each situation is summarized below. These estimates are based on the assumption that the various triggering events occurred on the last day of 2021,2023, along with other material assumptions noted below. The actual amounts that would be paid to a named executive officer upon termination or a change of control can only be determined at the time the actual triggering event occurs. The estimated amount of compensation and benefits described below does not take into account compensation and benefits that a named executive officer has earned prior to the applicable triggering event, such as equity awards that have previously vested in accordance with their terms or vested benefits otherwise payable under our compensation programs.
The following table and summary set forth potential payments we would be required to make to our named executive officers upon termination of employment or change of control. The table assumes termination of employment on December 31, 20212023 and uses a share price of $49.90,$102.80, the closing price of our stock on December 29, 2023, the last trading day of the fiscal year.
| | | | | | | | | | | | | | | | | | | | |
| Name | Benefit | Voluntary Termination/ Retirement ($) | Termination without
Cause or resignation
for Good Reason ($) | Permanent Disability
or Death ($) | Involuntary
Termination Following
Change of Control ($) | |
| C. Mark Hussey | Salary | — | 1,850,000 | — | 2,312,500 | |
| Bonus | — | 2,312,500 | — | 2,890,625 | |
| Pro rata annual bonus (1) | — | — | 1,156,250 | 1,676,563 | |
| Pro rata retention bonus (2) | — | 358,190 | 358,190 | 358,190 | |
| Equity acceleration (3) | — | — | 1,741,226 | 1,741,226 | |
| Benefits continuation | — | 27,608 | 6,902 | 27,608 | |
| Cutback (4) | — | — | — | -3,479,039 | |
| Total Value | — | 4,548,298 | 3,262,568 | 5,527,673 | |
| J. Ronald Dail | Salary | — | 650,000 | — | 975,000 | |
| Bonus | — | 585,000 | — | 877,500 | |
| Pro rata annual bonus (1) | — | 935,006 | 585,000 | 935,006 | |
| Equity acceleration (3) | — | — | 1,339,587 | 1,339,587 | |
| Benefits continuation | — | 17,975 | 8,988 | 26,963 | |
| Cutback (4) | — | — | — | -191,208 | |
| Total Value | — | 2,187,981 | 1,933,575 | 3,962,848 | |
| John D. Kelly | Salary | — | 575,000 | — | 862,500 | |
| Bonus | — | 575,000 | — | 862,500 | |
| Pro rata annual bonus (1) | — | 833,750 | 575,000 | 833,750 | |
| Pro rata retention bonus (2) | — | 170,765 | 170,765 | 170,765 | |
| Equity acceleration (3) | — | — | 2,261,394 | 2,261,394 | |
| Benefits continuation | — | 20,225 | 10,113 | 30,338 | |
| Cutback (4) | — | — | — | -1,436,170 | |
| Total Value | — | 2,174,740 | 3,017,272 | 3,585,077 | |
| | | | | | | | | | | | | | | | | | | | |
| Ernest W. Torain, Jr. | Salary | — | 450,000 | — | 675,000 | |
| Bonus | — | 337,500 | — | 506,250 | |
| Pro rata annual bonus (1) | — | 489,375 | 337,500 | 489,375 | |
| Pro rata retention bonus (2) | — | 66,640 | 66,640 | 66,640 | |
| Equity acceleration (3) | — | — | 491,692 | 491,692 | |
| Benefits continuation | — | 20,225 | 10,113 | 30,338 | |
| Cutback (4) | — | — | — | -954,904 | |
| Total Value | — | 1,363,740 | 905,945 | 1,304,391 | |
(1)Pro rata bonus for termination without Cause or resignation for Good Reason is based on actual 2023 performance. For retirement eligible individuals, executive would receive the full bonus earned payable at the originally scheduled payout date consistent with other executives and thus is not included in the table. As of December 31, 2023, Mr. Hussey satisfied the age and service retirement criteria for these programs. See the Compensation Discussion and Analysis of this Proxy Statement for disclosure regarding amount earned.
(2)Reflects pro rata vesting for the three-year cash retention award granted in 2021. | | | | | | | | | | | | | | | | | | | | | | |
| Name | | Benefit | | Voluntary
Termination/
Retirement ($) | | Termination without
Cause or resignation
for Good Reason ($) | | Permanent Disability or Death ($) | | Involuntary
Termination Following
Change of Control ($) |
James H. Roth | | Salary | | | | — | | | | | 1,900,000 | | | | | — | | | | | 2,375,000 | |
| | Bonus | | | | — | | | | | 2,660,000 | | | | | — | | | | | 3,325,000 | |
| | Pro rata annual bonus (1) | | | | — | | | | | — | | | | | 1,330,000 | | | | | 1,330,000 | |
| | Pro rata retention bonus (2) | | | | — | | | | | 616,420 | | | | | 616,420 | | | | | 616,420 | |
| | Equity acceleration (3) | | | | — | | | | | — | | | | | 1,364,066 | | | | | 3,814,505 | |
| | Benefits continuation | | | | — | | | | | 33,818 | | | | | 8,890 | | | | | 42,273 | |
| | | Cutback (4) | | | | — | | | | | — | | | | | — | | | | | — | |
| | | Total Value | | | | — | | | | | 5,210,238 | | | | | 3,319,376 | | | | | 11,503,198 | |
C. Mark Hussey | | Salary | | | | — | | | | | 1,200,000 | | | | | — | | | | | 1,600,000 | |
| | Bonus | | | | — | | | | | 1,200,000 | | | | | — | | | | | 1,600,000 | |
| | Pro rata bonus (1) | | | | — | | | | | 800,000 | | | | | 800,000 | | | | | 800,000 | |
| | Pro rata retention bonus (2) | | | | — | | | | | 358,190 | | | | | 358,190 | | | | | 358,190 | |
| �� | Equity acceleration (3) | | | | — | | | | | — | | | | | 892,012 | | | | | 2,494,283 | |
| | Benefits continuation | | | | — | | | | | 25,364 | | | | | 8,890 | | | | | 33,818 | |
| | | Cutback (4) | | | | — | | | | | — | | | | | — | | | | | — | |
| | | Total Value | | | | — | | | | | 3,583,554 | | | | | 2,059,092 | | | | | 6,886,291 | |
John D. Kelly | | Salary | | | | — | | | | | 525,000 | | | | | — | | | | | 787,500 | |
| | Bonus | | | | — | | | | | 472,500 | | | | | — | | | | | 708,750 | |
| | Pro rata bonus (1) | | | | — | | | | | 472,500 | | | | | 472,500 | | | | | 472,500 | |
| | Pro rata retention bonus (2) | | | | — | | | | | 170,765 | | | | | 170,765 | | | | | 170,765 | |
| | Equity acceleration (3) | | | | — | | | | | — | | | | | 1,127,391 | | | | | 2,019,193 | |
| | Benefits continuation | | | | — | | | | | 16,316 | | | | | 8,594 | | | | | 24,474 | |
| | | Cutback (4) | | | | — | | | | | — | | | | | — | | | | | (687,048 | ) |
| | | Total Value | | | | — | | | | | 1,657,081 | | | | | 1,779,250 | | | | | 3,496,134 | |
Ernest W. Torain, Jr. | | Salary | | | | — | | | | | 360,000 | | | | | — | | | | | 540,000 | |
| | Bonus | | | | — | | | | | 180,000 | | | | | — | | | | | 270,000 | |
| | Pro rata bonus (1) | | | | — | | | | | 180,000 | | | | | 180,000 | | | | | 180,000 | |
| | Pro rata retention bonus (2) | | | | — | | | | | 66,640 | | | | | 66,640 | | | | | 66,640 | |
| | Equity acceleration (3) | | | | — | | | | | — | | | | | 271,256 | | | | | 652,043 | |
| | Benefits continuation | | | | — | | | | | 16,909 | | | | | 8,890 | | | | | 33,818 | |
| | | Cutback (4) | | | | — | | | | | — | | | | | — | | | | | -81,379 | |
| | | Total Value | | | | — | | | | | 803,549 | | | | | 526,786 | | | | | 1,661,122 | |
(1) | Pro rata bonus for termination without Cause or resignation for Good Reason is based on actual performance from 2021. For retirement eligible individuals, executive would receive the full bonus earned payable at the originally scheduled payout date consistent with other executives and thus is not included in the table. (As of 12/31/21, Mr. Roth satisfied the age and service retirement criteria for these programs.) See CD&A for disclosure regarding amount earned.
|
If a named executive officer’s employment is terminated due to death, disability, termination without cause or resignation with good reason, he or his estate will receive payment of a pro-rated portion of the retention award through the date of termination, based on the award agreement. (2) | Reflects pro rata vesting for the 2021 Cash Retention Award. If a named executive officer’s employment is terminated due to death, disability, termination without cause or resignation with good reason, he or his estate will receive payment of a pro-rated portion of the retention award through the date of termination, based on the award agreement.
|
(3) | The acceleration of equity varies by grant and type of termination as outlined in the preceding sections. The value shown is equal to the number of accelerated shares times the closing price on the last day of the fiscal year. These amounts do not include the value of stock that continues to vest per the original schedule post termination, including:
|
| (a) | A portion of the 2021 performance units would continue to vest for each of the named executive officers with the number of shares determined based on actual performance through December 31, 2021 and prorated for the number of days that the executive was employed during the performance period.
|
| (b) | 100% of the 2019 performance units would continue to vest for each of the named executive officers with the number of shares determined based on actual performance through December 31, 2021 and prorated for the number of days that the executive was employed during the performance period; note that additional COC values may be included if the actual payout is below target as executives will receive the greatest of target or actual payout if terminated post COC.
|
| (c) | Additionally, in the event an executive qualifies for an approved retirement, they would receive continued vesting of their stock per the schedule as outlined in the grant agreements. (As of 12/31/21 Mr. Roth satisfied the age and service retirement criteria for these programs.)
|
| (d) | Time-based RSAs are forfeited in the event of a Termination without Cause or Resignation for Good Reason.
|
(4) | In the event the total COC severance exceeds the IRC 280G safe harbor amount, then the executive’s total severance is reduced to the maximum safe harbor threshold amount as to not trigger any excise tax.
|
COMPENSATION COMMITTEE INTERLOCKS(3)The acceleration of equity varies by grant and type of termination as outlined in the preceding sections. The value shown is equal to the number of accelerated shares times the closing price on the last day of the fiscal year. These amounts do not include the value of stock that continues to vest per the original schedule post termination, including:
(a) The 2022 and 2023 performance units would continue to vest for each of the named executive officers with the number of shares determined based on actual performance through December 31, 2023 and prorated for the number of days that the executive was employed during the performance period.
(b) All of the 2021 performance units would continue to vest for each of the named executive officers with the number of shares determined based on actual performance through December 31, 2023, which is the conclusion of the performance period.
(c) In the event an executive qualifies for an approved retirement, they would receive continued vesting of their stock per the schedule as outlined in the grant agreements. As of December 31, 2023, Mr. Hussey satisfied the age and service retirement criteria for these programs.
(c) Time‐based restricted stock awards and restricted stock units are forfeited in the event of a Termination without Cause or Resignation for Good Reason.
(4) In the event the total COC severance exceeds the IRC 280G safe harbor amount, then the executive’s total severance is reduced to the maximum safe harbor threshold amount as to not trigger any excise tax.
PAY VERSUS PERFORMANCE
The Company is providing the following disclosure about the relationship of the annual total compensation of our chief executive officer and other named executive officers to our total shareholder return, peer group shareholder return, our net income and our revenues. The information set forth below was not used by the Compensation Committee in setting compensation for our named executive officers as set forth in the Summary Compensation Table.
| | | | | | | | | | | | | | | | | | | | | | | | | | | | | |
| | | | | Value of Initial Fixed $100 Investment Based On: | | | |
| Year | Summary Compensation Table Total for PEO ($)(1) | Compensation Actually Paid to PEO ($)(3) | Average Summary Compensation Table Total for Non-PEO NEOs ($)(2) | Average Compensation Actually Paid to Non-PEO NEOs ($)(2)(3) | Total Shareholder Return ($)(4) | Peer Group Total Shareholder Return ($)(4) | Net Income
($'000s) | Revenues
($'000s) | |
| 2023 | 5,706,403 | 10,225,755 | 2,387,211 | 4,398,093 | 150 | 126 | 62,479 | 1,362,060 | |
| 2022 | 6,066,630 | 8,811,255 | 2,637,060 | 3,593,717 | 106 | 122 | 75,552 | 1,132,455 | |
| 2021 | 3,595,855 | 1,428,917 | 1,579,259 | 709,973 | 73 | 124 | 62,987 | 905,640 | |
| 2020 | 3,991,446 | 1,314,867 | 1,691,684 | 1,003,158 | 86 | 94 | (23,840) | 844,127 | |
(1)The principal executive officer (PEO) included in the summary compensation table total and compensation actually paid (CAP) total for 2023 was C. Mark Hussey. The PEO for years 2022, 2021 and 2020 was James H. Roth.
(2)The non-PEO NEOs included in the average summary compensation table total and average CAP for each year are as follows:
•2023 - J. Ronald Dail, John D. Kelly, and Ernest W. Torain, Jr.
•2022 - C. Mark Hussey, J. Ronald Dail, John D. Kelly and Ernest W. Torain, Jr.
•2021 - C. Mark Hussey, John D. Kelly and Ernest W. Torain, Jr.
•2020 - C. Mark Hussey, John D. Kelly, Ernest W. Torain, Jr. and Diane Ratekin
(3)CAP was calculated by subtracting from the summary compensation total the grant date fair value of awards included in the summary compensation total, adding/(subtracting) the year-over-year change in fair value of unvested equity, adding/(subtracting) the year-over-year change in fair value of prior years' unvested equity that vested in the current year (valued as of the vest date), and adding the fair value of equity compensation granted in the current year (valued as of year-end). No dividends were paid in any year presented.
Below is additional information on the total amount of equity compensation included in CAP for the PEO and the average amount of equity compensation included in CAP for the non-PEO NEOs for 2023:
| | | | | | | | | | | | | | | | | | | | | | | | | | | | | | | | |
| Components of PEO Equity Compensation Included in CAP | | Components of non-PEO NEO Equity Compensation
Included in CAP | |
| ($) | Fair Value of Equity Awards Granted in Current Year | Change in Fair Value of Unvested Equity Awards Granted in a Prior Year | Change in Fair Value of Equity Awards Vested in Current Year | Total Fair Value of Equity Awards included in CAP | | Fair Value of Equity Awards Granted in Current Year | Change in Fair Value of Unvested Equity Awards Granted in a Prior Year | Change in Fair Value of Equity Awards Vested in Current Year | Total Fair Value of Equity Awards included in CAP | |
| PSU | 2,875,768 | 3,247,489 | (7,552) | 6,115,705 | | 975,429 | 1,311,638 | (3,253) | 2,283,814 | |
| PSO | — | — | — | — | | — | 65,231 | 8,292 | 73,523 | |
| Restricted Stock | 787,140 | 280,286 | (21,054) | 1,046,372 | | 354,215 | 296,715 | (6,048) | 644,882 | |
| Total | 3,662,908 | 3,527,775 | (28,606) | 7,162,077 | | 1,329,644 | 1,673,584 | (1,009) | 3,002,219 | |
(4)The pay versus performance table above and the graph below compare the cumulative total shareholder return (TSR) on our common stock against the cumulative TSR of the stocks making up an industry peer group from December 31, 2019 through December 31, 2023. The industry peer group, which is consistent with the peer group used by the Company for its S-K Item 201(e) disclosures within the 2023 Annual Report on Form 10-K, is comprised of the following companies: CRA International, Inc. (CRAI), FTI Consulting, Inc. (FCN), ICF International, Inc. (ICFI), Premier, Inc. (PINC) and Resources Connection, Inc. (RGP). The graph and table assume a $100 investment in Huron Consulting Group Inc. common stock and an index of the industry peer group on December 31, 2019. The annual TSR for each member of the peer group assumes all dividends are reinvested and was weighted based on its stock market capitalization at the beginning of each year presented.
The below graphs illustrate the relationship between the compensation actually paid (CAP) to the principal executive officer (PEO) and the average of the non-PEO NEOs and i) total shareholder return for Huron and the peer group, ii) revenues and iii) net income from 2020 through 2023.
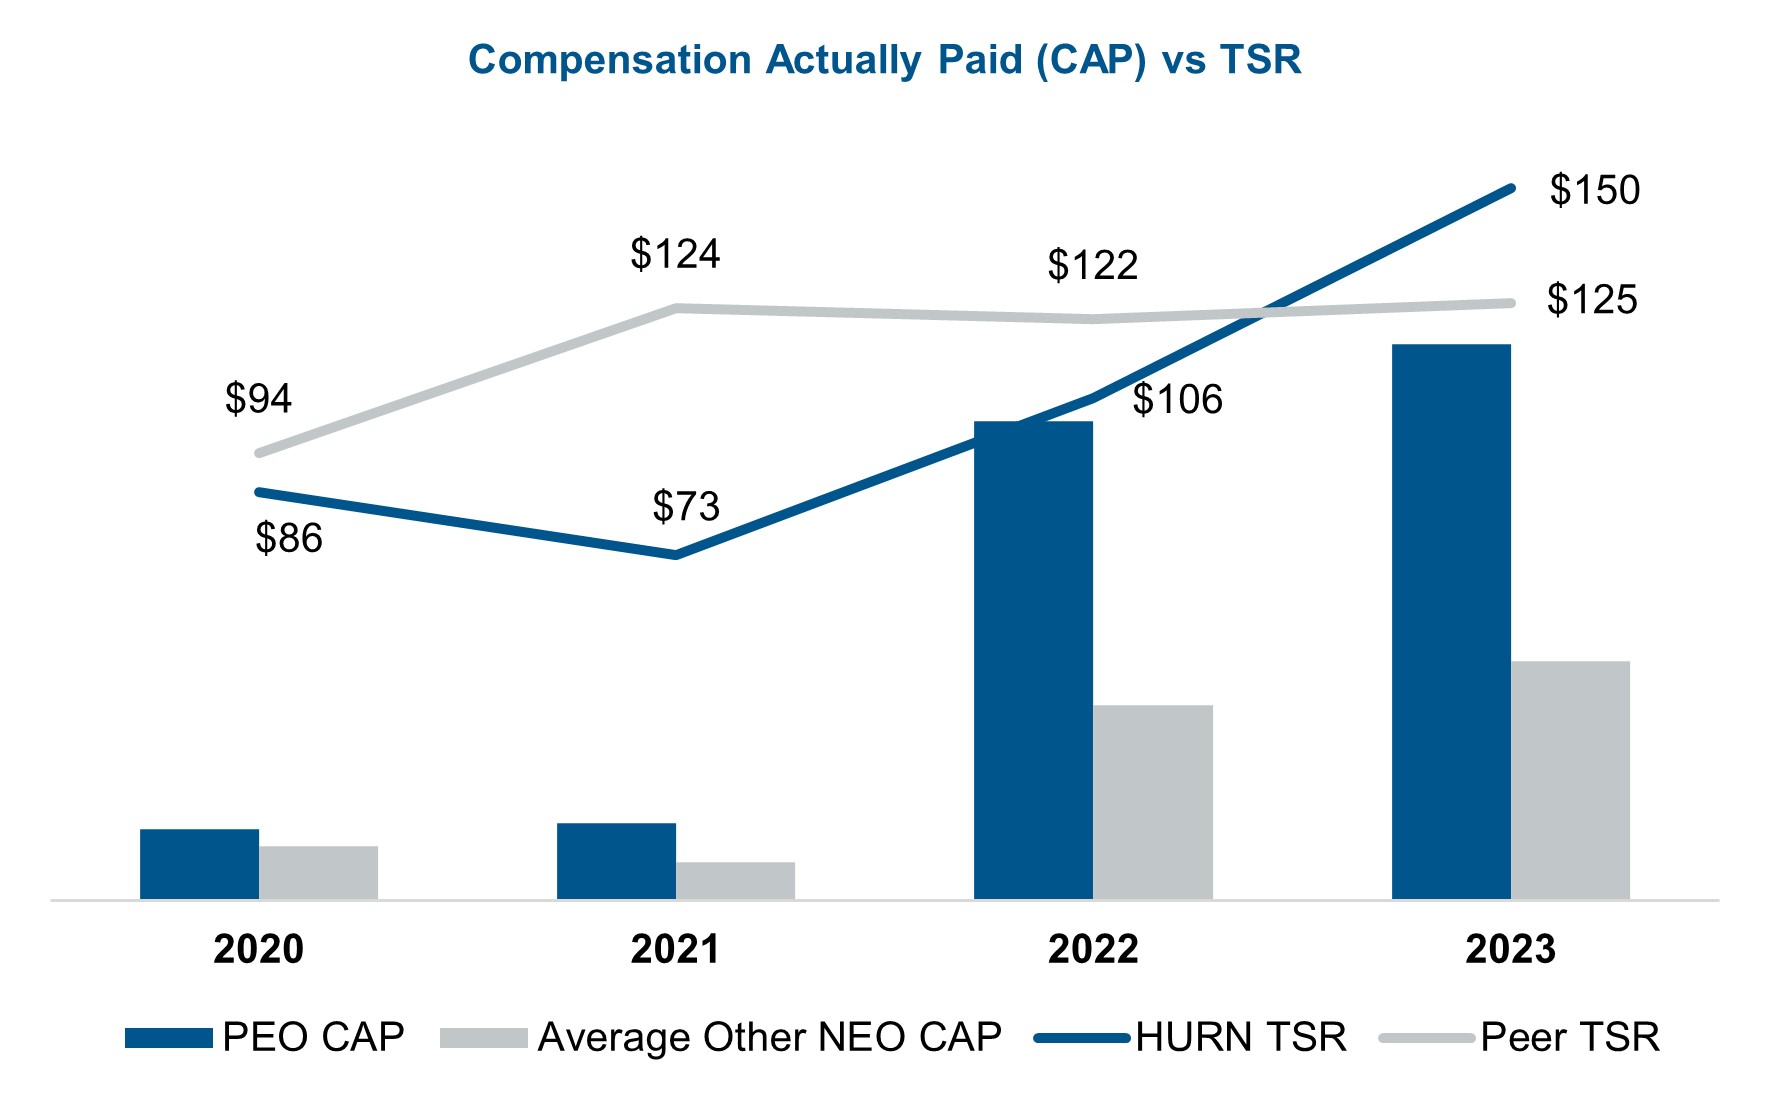
The increase in the PEO and Other NEO CAP in 2022 as compared to 2021 and 2020 is primarily due to the increase in the fair value of equity awards. From December 31, 2021 to December 31, 2022, our stock price increased from $49.90 to $72.60 and the expected funding of the 2020 and 2021 performance-based awards tied to performance against Adjusted Diluted EPS and Revenue Growth metrics increased from 0% to 19% for the 2020 awards and 100% to 153% for the 2021 awards. The increase in the PEO and Other NEO CAP in 2023 also related to the increase in the fair value of equity awards. From December 31, 2022 to December 31, 2023, our stock price increased from $72.60 to $103.80 and the expected funding of the 2021 and 2022 performance-based awards tied to performance against Adjusted Diluted EPS and Revenue Growth metrics increased from 153% to 194% for the 2021 awards and 100% to 182% for the 2022 awards.
Financial Performance Measures
The Compensation Committee uses the following four financial measures when determining actual compensation paid to the named executive officers:
•Revenue growth;
•Organic revenue growth;
•Adjusted EBITDA margin; and
•Adjusted diluted earnings per share.
CEO PAY RATIO
As required by Section 953(b) of the Dodd-Frank Wall Street Reform and Consumer Protection Act, the Company is providing the following disclosure about the relationship of the annual total compensation of our median-paid employee to the annual total compensation of Mr. Hussey, our CEO. We believe that the pay ratio disclosed below is a reasonable estimate calculated in a manner consistent with Item 402(u) of Regulation S-K. SEC rules for identifying the median employee and calculating the pay ratio allow companies to apply various methodologies and apply various assumptions and, as a result, the pay ratio reported by us may not be comparable to the pay ratio reported by other companies.
For 2023:
•The annual total compensation of our median employee was $107,781.
•Mr. Hussey’s annual total compensation, as reflected in the Summary Compensation Table included in this Proxy Statement, was $5,706,403.
•Based on this information, the ratio of the annual total compensation of Mr. Hussey to the annual total compensation of our median employee is estimated to be 52.9 to 1.
The calculation of the 2023 CEO Pay Ratio used the same median employee as used in 2022. As permitted by SEC rules, we used the same median employee that was identified in the preparation of our pay ratio in 2022 because there has been no change in our employee population or compensation arrangements that we believe would significantly impact our pay ratio disclosure. In 2022, we identified the median employee by examining the 2022 total cash compensation for all individuals, excluding our CEO, who were employed by us on December 31, 2022. We included all employees, whether employed on a full-time or part-time basis. We annualized the base compensation and bonus for all employees that were not employed by us for all of 2022 unless they were designated as temporary or seasonal positions.
In addition, in order to identify our median employee in 2022, we (i) utilized the exemption permitted under Item 402(u) of Regulation S-K to exclude a total of 137 employees from Canada, the United Kingdom, Singapore, and Switzerland (which, in the aggregate, comprised less than 5% of our total employee population as of December 31, 2022), resulting in a net employee population of 5,652, of which 1,575 are located in India and (ii) adjusted non-U.S. employee pay applying foreign currency exchange rates as of December 31, 2022.
We calculated 2023 annual total compensation for our median employee using the same methodology we use for our NEOs as set forth in the Summary Compensation Table.
COMPENSATION COMMITTEE INTERLOCKS AND
INSIDER PARTICIPATION INSIDER PARTICIPATION
During
2021,2023, there were no Compensation Committee interlocks and no insider participation in Compensation Committee decisions that were required to be reported under the rules and regulations of the 1934 Act.
CERTAIN RELATIONSHIPS
CERTAIN RELATIONSHIPS AND
RELATED TRANSACTIONS RELATED TRANSACTIONS
It is the responsibility of the Audit Committee to review and approve, ratify or disapprove proposed transactions or courses of dealings with respect to which executive officers or directors or members of their immediate families have an interest (including all transactions required to be disclosed pursuant to the SEC’s related person disclosure requirements). In addition, it is the policy of management and board members to discuss at a meeting of the board of directors, or the appropriate board committee, those transactions requiring disclosure pursuant to the SEC’s related person disclosure requirements between Huron and a board member or a principal stockholder and members of their immediate families.
In addition, Huron has a Code of Business Conduct and Ethics (the “Code"Code of Conduct”Conduct"), a copy of which is posted on our web site at www.huronconsultinggroup.com, that applies to directors and employees and their family members. The Code of Conduct, among other things, has a policy governing conflicts of interest generally and, in particular, prohibiting certain business arrangements with the Company and clients of the Company, entering into relationships that may be perceived as impairing the ability of the individual or Huron from performing his/her or its duties, as the case may be, in an impartial manner, and use of corporate property for improper personal gain. Any exceptions require disclosure and approval by the Chief Compliance Officer and, in the case of officers and directors, by the Audit Committee of the board of directors. The Code of Conduct also prohibits Huron from making any personal loans or guaranteeing any personal obligations of board members and executive officers.
Compensation of the Vice Chairman
As of January 1, 2023, James H. Roth was appointed as Vice Chairman, Client Services by the Board and this change in role marked the conclusion of his tenure as an executive officer. In this new full-time capacity, Mr. Roth assists in strategic and market-facing activities concentrating on engaging directly with clients in Huron’s core industries, originating business in existing and adjacent markets and engaging with new clients, cultivating new client relationships, and ensuring exceptional service delivery across the company. In addition to his 44 years of client-focused experience, Mr. Roth continues to play an active and pivotal role mentoring and developing the next generation of Huron leaders. Mr. Roth does not receive compensation for his director duties but is remunerated commensurate with his new responsibilities for revenue generation, client service and developing leaders.
In 2023, Mr. Roth received compensation of $3,594,914 comprised of $902,081 for base salary, a $740,000 retention bonus, $1,017,000 non-equity incentive plan compensation, $1,027,257 stock award grants and $25,576 in other benefits. The retention bonus represents the second installment of the three-year cash retention award granted to Mr. Roth as chief executive officer in 2021 to retain his leadership through the COVID-19 pandemic. The stock awards include the grant date fair value of $170,029 for 2,342 restricted stock units granted on January 1, 2023, with a four year annual vesting schedule; and the grant date fair value of $857,228 for 7,954 performance share units granted on February 23, 2023, which represents the third, and final, component of the 2021 long-term incentive award awarded to executive officers in 2021 that is funded based on performance during the 2021-2023 performance cycle. For additional information on the 2021 long-term incentive award, please see the information in the Compensation Discussion and Analysis of this Proxy Statement.
Set forth below is a brief description of the material terms of the senior management agreement for Mr. Roth ("Roth Agreement") as previously disclosed on the Form 8-K filed by the Company on December 20, 2022.
Term: The Roth Agreement is effective January 1, 2023, and continued for one year from that date. Following the expiration of the initial one-year term, the Roth Agreement has been renewed and extended for an additional year. Any subsequent renewal will be for a one-year term or such longer period subject to the approval of the Board. The Roth Agreement may be earlier terminated by Mr. Roth or the Company pursuant to its terms.
Base Salary: The Roth Agreement entitles Mr. Roth to an annual base salary. For the 2023 calendar year, Mr. Roth's annual base salary was $900,000.
Annual Bonus: Each calendar year, Mr. Roth is eligible for an annual bonus in an amount determined by the Chief Executive Officer based on the Company’s and Mr. Roth’s performance and the Company’s compensation policies. For the 2023 calendar year, Mr. Roth's annual target bonus was $900,000.
Equity Awards: Mr. Roth is generally eligible to participate in the Company’s equity plans, with the amount and terms of any equity awards to be determined by the Chief Executive Officer, subject to the approval of the Compensation Committee, based on the Company’s and Mr. Roth’s performance and the Company’s compensation policies. The terms and conditions of each equity award are subject to the terms of the applicable equity inventive plan of the Company and the equity awards' grant agreements.
Other Benefits: Mr. Roth is eligible to participate in the Company’s various health and welfare benefit plans for its similarly-situated employees. Additionally, Mr. Roth is eligible to participate in the executive physical program provided to key management employees.
Post-Termination Payments: If Mr. Roth's employment is terminated by the Company without Cause (as defined in the Roth Agreement), Mr. Roth will be entitled to: (i) severance pay in an amount equal to six months' of Mr. Roth's annual base salary (ii) continuation of medical benefits for 12 months upon the same terms as exist from time to time for active similarly-situated employees of the Company; and (iii) an amount in cash equal to the annual bonus that Mr. Roth would have earned for the year of termination had he remained employed for the year in which his termination occurs based on his performance, prorated for the number of completed days of employment during the year of termination.
Death or Permanent Disability: If Mr. Roth's employment is terminated due to Mr. Roth’s death or permanent disability, then Mr. Roth or Mr. Roth's estate will be entitled to (i) payment of Mr. Roth's base salary through the date of termination; (ii) if the termination due to Mr. Roth's death or permanent disability occurs during the initial one-year term of the Roth Agreement, an amount in cash equal to the then-prevailing target amount of Mr. Roth's annual bonus, prorated for the number of completed days of employment during that year; and (iii) vesting of any outstanding time-based or performance-based equity will be treated in accordance with the applicable equity agreement then in effect. Additionally, if Mr. Roth's employment is terminated due to Mr. Roth's death or permanent disability, then Mr. Roth or Mr. Roth's eligible dependents will be entitled to continuation of medical benefits upon the same terms as exist immediately prior to the termination of employment for similarly-situated active employees of the Company for the six-month period immediately following the termination of employment.
Change of Control: Subsequent to the initial one-year term of the Roth Agreement, Mr. Roth is not entitled to enhanced compensation or benefits stemming from a termination due to a Change of Control.
The receipt of the post-termination benefits described above are conditioned on Mr. Roth’s compliance with the covenants, warranties, representations and agreements set forth in Roth Agreement, as well as his execution and acceptance of the terms and conditions of a general release in the standard form used by the Company.
The Roth Agreement further provides that if any amount, right or benefit paid or payable to Mr. Roth under the Roth Agreement or any other plan, program or arrangement would constitute an “excess parachute payment” under Section 280G of the Internal Revenue Code of 1986, as amended (the “Code”), subject to the excise tax imposed by Section 4999 of the Code, then the amount of payments payable to Mr. Roth under the Roth Agreement will be reduced to the extent necessary so that no portion of such payments is subject to such excise tax.
TO APPROVE AN AMENDMENT TO THE COMPANY'S RESTATED CERTIFICATE OF INCORPORATION
The board of directors has unanimously approved, and recommends, that the Company's stockholders approve an Amendment to the Company’s Restated Certificate of Incorporation (the "COI") providing for the exculpation of the Company's officers (the “Exculpation Amendment”). The full text of the Exculpation Amendment is set forth in Appendix A to this Proxy Statement.
Background
In August 2022, Section 102(b)(7) of the General Corporation Law of the State of Delaware (the “DGCL”) was amended to allow a Delaware corporation to adopt a provision in its certificate of incorporation to eliminate or limit monetary liability for certain corporate officers for breach of the fiduciary duty of care in certain circumstances. Previously, the DGCL allowed exculpation only of directors for breach of the fiduciary duty of care. As amended, Section 102(b)(7) of the DGCL authorizes corporations to provide for exculpation of the following officers: (i) the corporation's president, chief executive officer, chief operating officer, chief financial officer, chief legal officer, controller, treasurer or chief accounting officer, (ii) "named executive officers" identified in the corporation's SEC filings, and (iii) other individuals who have agreed with the corporation to be identified as officers of the corporation for purposes of Section 102(b)(7).
Consistent with Section 102(b)(7) prior to the recent amendments, our current COI provides for certain liability protections of directors. The Company is committed to reviewing and adopting corporate governance practices that are in the best interest of both the Company and its stockholders and has evaluated the Company’s liability protections under Section 102 that provides for the exculpation of its officers. After reviewing our governance practices, the board of directors has determined that it is in the best interest of the Company and its stockholders to adopt the Exculpation Amendment for the reasons outlined below.
Proposed Amendment to the Restated Certificate of Incorporation
The board of directors believes that amending our COI to provide protection from certain liabilities and expenses for certain of our officers is both necessary and in the best interests of the Company and its stockholders. In order to remain competitive and continue to attract and retain experienced and qualified executives, we believe it is essential to provide such protections for our officers, as similar officer exculpation provisions have been, and are likely to be, adopted by our peers and others with whom we compete for executive talent. Without such protections, prospective or current officers may be discouraged from accepting or continuing employment with the Company.
The proposed Exculpation Amendment would also more generally align the protections available to our officers with those protections currently available to our directors. The nature of the role of directors and officers often requires them to make decisions on crucial matters. Frequently, directors and officers must make decisions in response to time-sensitive opportunities and challenges, which can create substantial risk of investigations, claims, actions, suits or proceedings seeking to impose liability on the basis of hindsight. For similar reasons as to why we already grant these protections to our directors, we believe the Exculpation Amendment would enhance the ability of our officers to make decisions that will maximize Huron’s value and empower our officers to exercise their business judgment in furtherance of stockholder interests by decreasing concerns about personal risk of legal action while also minimizing the potential distraction posed by frivolous lawsuits and costs that are often borne by us either directly, through indemnification, or indirectly through higher insurance premiums.
Section 102(b)(7) of the DGCL, as amended, only permits, and the Exculpation Amendment would only permit, the exculpation of our officers in connection with direct claims brought by stockholders, but would not eliminate officers' monetary liability for breach of fiduciary duty claims brought by the Company itself or for derivative claims brought by our stockholders in the name of the Company. In addition, as is currently the case with directors under our COI, the Exculpation Amendment would not limit the liability of officers for any breach of the duty of loyalty to the Company or its stockholders, any acts or omissions not in good faith or which involve intentional misconduct or a knowing violation of the law, or any transaction from which the officer derived an improper personal benefit.
In determining the advisability of the Exculpation Amendment, the board of directors considered the narrow class and type of claims from which the covered officers would be exculpated from liability pursuant to Section 102(b)(7) of the DGCL, the limited number of our officers to which the protections would apply, and the benefits the board believes would accrue to the Company and its stockholders by extending exculpation protection to certain of its officers in addition to its directors. Given the potential benefits to the Company, including the associated benefits to our stockholders, and the limited types of claims that would be exculpated, the board recommends that the stockholders approve the Exculpation Amendment.
The text of the Exculpation Amendment is set forth in Appendix A to this Proxy Statement.
If the Exculpation Amendment is approved by our stockholders, then the Exculpation Amendment will become effective upon its filing with the Delaware Secretary of State.
Approval Required
The approval of the Exculpation Amendment requires the affirmative vote of at least two-thirds of the issued and outstanding shares of common stock. Abstentions and broker non-votes will have the same effect as a vote against the proposal. Executed proxies will be voted “FOR” the approval of the proposal, unless specified otherwise.
THE BOARD OF DIRECTORS RECOMMENDS THAT STOCKHOLDERS VOTE “FOR” APPROVAL OF THE AMENDMENT TO THE COMPANY’S RESTATED CERTIFICATE OF INCORPORATION.
PROPOSAL 3
TO APPROVE AN AMENDMENT TO THE COMPANY'S STOCK OWNERSHIP PARTICIPATION PROGRAM
To enable us to continue to attract and retain diverse, highly qualified employees, on [ ], 2024, our board of directors approved, subject to stockholder approval, an amendment to the Company's Stock Ownership Participation Program (the "SOPP" or "Plan") to increase the number of shares available for grant under the Plan by 200,000 shares and to extend the term of the Plan through May 3, 2034. A copy of the amendment to the Plan is attached as Appendix B to this Proxy Statement.
Background and Reasons for Amending the Plan
Huron operates in a highly competitive talent market and our compensation philosophy is focused on motivating and effectively rewarding our professionals for their significant contributions. To continue to attract and retain highly qualified employees, align those employees' interests with stockholders' interests, foster a strong commitment to the Company's growth strategy, and provide an opportunity to share in the growth of the Company, we believe it is critical to provide an opportunity for employee stock ownership.
Huron's non-qualified Stock Ownership Participation Program (the "SOPP" or "Plan") was initially approved by shareholder vote in 2015, and has since become a key feature of our Total Rewards program for employees who do not receive equity-based awards as part of their normal compensation plan. The SOPP encourages broad-based participation across our employee population. As of December 31, 2023, the SOPP was available to 6,286 eligible employees, which represents 95% of our global workforce.
Subject to the limitations set forth in the Plan, eligible employees may elect to contribute up to an aggregate amount of $20,000 per calendar year of their base salary and/or annual bonus through after-tax payroll deductions. Accumulated contributions made during the offering periods are used to purchase shares of the Company's common stock at the current stock price on the date of purchase.
Employees who purchase stock under the Plan receive a 25% restricted stock unit match, which vests after one year so long as the purchased shares are held by the employee for the specified holding period. The terms of the matched shares, including the number of shares granted and the vesting requirements, are set forth in a separate restricted stock unit grant agreement. We have chosen to offer a restricted stock unit match instead of a traditional discount in order to encourage participation by employees who are prepared to own Huron stock for the required holding period.
Forfeited shares subject to the restricted stock unit match under the SOPP will again become available for award under the SOPP, as will any shares that are retained by the Company as payment of tax withholding obligations upon vesting of the award.
The summary of the SOPP set forth above is qualified in its entirety by the full text of the SOPP plan document.
As of March 4, 2024, 106,651 shares of common stock remained available for grant under the Plan. With approval of the 200,000 share increase, the total number of shares available for future grant will increase to 306,651 shares, which represents approximately 1.7% of outstanding common shares.
Approval Required
The approval of the amendment to the SOPP requires the affirmative vote of the holders of a majority of the total shares of common stock present in person, or represented by proxy, and entitled to vote on the proposal, provided that a quorum is represented at the meeting. Abstentions will have the same effect as a vote against the proposal. Broker non-votes will not be considered shares entitled to vote with respect to approval of the proposal and will not be counted as votes for or against the proposal and will therefore have no effect on the outcome of the proposal. Executed proxies will be voted "FOR" the approval of the proposal, unless specified otherwise.
THE BOARD OF DIRECTORS RECOMMENDS THAT STOCKHOLDERS VOTE “FOR” APPROVAL OF THE AMENDMENT TO THE COMPANY’S STOCK OWNERSHIP PARTICIPATION PROGRAM.
Tax Consequences
The following provides only a general description of the applicable U.S. federal income tax laws to awards under the SOPP. This discussion is intended for the information of our stockholders considering how to vote at the Annual Meeting and not as tax guidance to participants in the SOPP. This summary does not address in any detail the effects of taxes imposed under state, local or foreign tax laws.
Purchase of Stock. The purchase of common stock pursuant to the SOPP is not a taxable event to the participant. A participant’s basis in the common stock purchased is equal to the participant’s purchase price on the date it is acquired. The Company is not entitled to an income tax deduction in connection with a participant's purchase of common stock pursuant to the SOPP.
Restricted Stock Awards and Restricted Stock Units.If a restriction on transferability and substantial risk of forfeiture applies to shares of common stock actually distributed to a participant under an award (such as a grant of restricted stock), the participant generally must recognize ordinary income equal to the fair market value of the transferred amounts at the earliest time either the transferability restriction or risk of forfeiture lapses. In the usual case, we can claim a tax deduction (subject to the limit under Section 162(m) of the Code) in an amount equal to the ordinary income recognized by the participant, except as discussed below. A participant may choose to make a special filing to elect to be taxed at the time of grant of restricted stock rather than upon the lapse of restrictions on transferability or risk of forfeiture, but if the participant subsequently forfeits such shares of common stock or property he or she would not be entitled to any tax deduction, including as a capital loss, for the value of shares of common stock on which he or she previously paid tax.
If no substantial risk of forfeiture applies to property distributed to a participant, the participant generally must recognize ordinary income equal to the fair market value of shares of common stock actually received.
With respect to restricted stock units, the participant generally must recognize ordinary income for U.S. income tax purposes when the award is paid in an amount equal to the amount payable or, if the award is settled in shares of common stock, the fair market value on the date of distribution, and we would normally be entitled to a corresponding deduction.
PROPOSAL 4
ADVISORY VOTE TO APPROVE THE COMPANY’S EXECUTIVE COMPENSATION
As required by the Dodd-Frank Wall Street Reform and Consumer Protection Act of 2010 (the “Dodd-Frank Act”) and the SEC, Huron annually
is askingasks its stockholders to indicate their support for our named executive officer compensation, which includes the compensation discussion and analysis, the compensation tables and the related narrative disclosures, all as described in the section entitled “EXECUTIVE COMPENSATION—Compensation Discussion and Analysis.”
The vote solicited by this proposal, commonly known as “Say on Pay,” is advisory in nature and will not be binding on the board of directors, the Compensation Committee or Huron. However, the board of directors and the Compensation Committee value the opinions of our stockholders, will review the voting results and, to the extent determined appropriate, take into account the outcome of the vote during future deliberations on executive compensation arrangements.
Huron believes that its executive compensation program is structured to support Huron and its business objectives. This vote is not intended to address any one specific item of compensation, but rather the overall compensation of our named executive officers and the philosophy, policies and practices described in this Proxy Statement.
The affirmative vote of the holders of a majority of the total shares of common stock, present in person or represented by proxy and entitled to vote on the proposal, is required to approve the advisory vote on the compensation arrangements of our named executive officers. Abstentions will have the same effect as a vote against the proposal. Broker
non-votes will not be considered shares entitled to vote with respect to the proposal and will not be counted as votes for or against the proposal and will therefore have no effect on the outcome of the proposal. Proxies submitted pursuant to this solicitation will be voted “FOR” the approval of the advisory vote on the compensation arrangements of our named executive officers, unless specified otherwise.
THE BOARD OF DIRECTORS RECOMMENDS THAT STOCKHOLDERS VOTE “FOR”FOR” THE COMPENSATION OF OUR NAMED EXECUTIVE OFFICERS AS DISCLOSED IN THE COMPENSATION DISCUSSION AND ANALYSIS SECTION AND THE ACCOMPANYING COMPENSATION TABLES AND NARRATIVE DISCUSSION IN THIS PROXY STATEMENT.
RATIFICATION OF APPOINTMENT OF INDEPENDENT REGISTERED PUBLIC ACCOUNTING FIRM
PricewaterhouseCoopers LLP (“PwC”), which has been the independent registered public accounting firm for the Company since its inception, has been appointed by the Audit Committee as the independent registered public accounting firm for the Company and its subsidiaries for the fiscal year ending December 31,
2022.2024. This appointment is being presented to the stockholders for ratification. The ratification of the appointment of PwC as the independent registered public accounting firm requires the affirmative vote of the holders of a majority of the total shares of common stock present in person or represented by proxy and entitled to vote on the proposal, provided that a quorum is represented at the
meeting.Annual Meeting. Abstentions will have the same effect as a vote against ratification. Broker
non-votes will not be considered shares entitled to vote with respect to ratification of the appointment and will not be counted as votes for or against the ratification and will therefore have no effect on the outcome of this proposal. Proxies submitted pursuant to this solicitation will be voted “FOR” the ratification of PwC as the Company’s independent registered public accounting firm for the fiscal year ending December 31,
2022,2024, unless specified otherwise.
THE BOARD OF DIRECTORS RECOMMENDS THAT STOCKHOLDERS VOTE “FOR”FOR” THE RATIFICATION OF THE APPOINTMENT OF PRICEWATERHOUSECOOPERS LLP AS THE COMPANY’S INDEPENDENT REGISTERED PUBLIC ACCOUNTING FIRM FOR THE FISCAL YEAR ENDING DECEMBER 31, 2022.2024.
Representatives of PwC are expected to be present at the Annual Meeting and will be provided an opportunity to make a statement and to respond to appropriate inquiries from stockholders.
AUDIT
AUDIT AND
NON-AUDIT FEES NON-AUDIT FEES
The following table presents fees for professional audit services rendered by PwC for the audit of the Company’s annual financial statements for the years ended December 31,
20212023 and December 31,
2020,2022, and fees for other services rendered by PwC during those periods:
| | | | | | | | | | | | |
| | | 2021 | | | | | | 2020 | |
| | | (in thousands) | |
Audit Fees | | $ | 1,831 | | | | | | | $ | 1,627 | |
Audit-Related Fees | | $ | 10 | | | | | | | $ | 10 | |
Tax Fees | | $ | 297 | | | | | | | $ | 261 | |
All Other Fees | | $ | 3 | | | | | | | $ | 318 | |
Total | | $ | 2,141 | | | | | | | $ | 2,216 | |
| | | | | | | | | | | | | | |
| 2023 | | 2022 | |
| (in thousands) | |
| Audit Fees | $1,695 | | | $1,675 | | |
| Audit-Related Fees | $10 | | | $20 | | |
| Tax Fees | $274 | | | $268 | | |
| All Other Fees | $11 | | | $10 | | |
| Total | $1,990 | | | $1,973 | | |
Audit Fees—all services, including tax services, necessary to perform an audit of the consolidated financial statements of Huron; services in connection with statutory and regulatory filings or engagements, comfort letters, statutory audits, attest services and consents; and assistance with and review of documents filed with the SEC.
Audit-Related Fees—attest services that are not required by statute or regulations.
Tax Fees—tax compliance (review of original and amended tax returns, claims for refund and tax payment-planning services); tax planning; and other tax advice (assistance with tax audits and appeals, tax advice related to structural matters, and requests for rulings or technical advice from taxing authorities).
All Other Fees—any other workservice that is not audit, audit-related or a tax service. In 2020, $315,000 in fees were incurred related to the implementation of a new cloud-based enterprise resource planning system. The Audit Committee considers whether the provision of these services is compatible with maintaining the independence of the independent registered public accounting firm and has determined such services for fiscal 20212023 and 20202022 were compatible.
POLICY ON
AUDIT COMMITTEE PREAPPROVAL AUDIT COMMITTEE PREAPPROVAL OF AUDIT AUDIT AND NON-AUDIT SERVICES NON-AUDIT SERVICES OF INDEPENDENT REGISTERED PUBLIC ACCOUNTING FIRM INDEPENDENT REGISTERED PUBLIC ACCOUNTING FIRM
The Audit Committee is responsible for appointing, setting compensation and overseeing the work of the independent registered public accounting firm. The Audit Committee has established a policy regarding preapproval of all audit and
non-audit services provided by the independent registered public accounting firm.
The Audit Committee, on a periodic basis, determines certain services that have the general preapproval of the Audit Committee. The Audit Committee must separately preapprove any services not receiving such general preapproval. Requests for such approval must be submitted by both the independent registered public accounting firm and the CFO and must include a joint statement as to whether, in their view, the request is consistent with the SEC’s rules on auditor independence. As appropriate, the Audit Committee then
pre-approvespreapproves the services and the related estimated fees. The Audit Committee will establish preapproved fee levels for all services to be provided by the independent registered public accounting firm. On a periodic basis, the CFO and the independent registered public accounting firm report to the Audit Committee regarding the actual spending for such projects and services compared to the approved amounts.
REPORT
REPORT OF
THE AUDIT COMMITTEE AUDIT COMMITTEE
The primary purpose of the Audit Committee is to assist the board of directors in its general oversight of the Company’s financial reporting process. The Audit Committee conducted its oversight activities for Huron Consulting Group Inc. and subsidiaries
(“Huron”) in accordance with the duties and responsibilities outlined in the Audit Committee charter.
Huron’s management is responsible for the preparation, consistency, integrity and fair presentation of
theits consolidated financial statements, accounting and financial reporting principles,
systems of internal control
over financial reporting, and disclosure controls and procedures designed to ensure compliance with accounting standards, applicable laws and regulations. Huron’s independent registered public accounting firm, PwC, is responsible for performing an independent audit of Huron’s financial statements and the effectiveness of internal control over financial reporting.
The Audit Committee, with the assistance and support of
Huron’sHuron's management and its finance and accounting team, has fulfilled its objectives, duties and responsibilities as stipulated in the Audit Committee charter and has provided adequate and appropriate independent oversight and monitoring of Huron’s systems of internal control for the fiscal year ended December 31,
2021.2023.
These activities included, but were not limited to, the following for the fiscal year ended December 31,
2021:2023:•Discussed with Huron’s internal auditors their continuing work in support of examination of internal controls and financial compliance controls.
•Reviewed and discussed with management and PwC the audited financial statements and the quarterly financial statements for the year ended December 31, 2021.2023. Management has the primary responsibility for such financial statements.
•Discussed with PwC the matters requiring discussion under current auditing standards.
•Received the written disclosures and the letter from PwC in accordance with the applicable requirements of the Public Company Accounting Oversight boardBoard regarding PwC’s communications with the Audit Committee concerning independence.
In reliance on the Audit Committee’s review and discussions of the matters referred to above, the Audit Committee recommended to the board of directors that the audited financial statements be included in Huron’s Annual Report on Form
10-K for the fiscal year ended December 31,
20212023 for filing with the Securities and Exchange Commission.
Peter K. Markell, Chairman
H. Eugene Lockhart
ChairmanHugh E. Sawyer
SUBMISSION OF STOCKHOLDER PROPOSALS
In order to be included in the Company’s proxy statement relating to its next annual meeting, stockholder proposals must be received no later than November
25, 202222, 2024 by the Corporate Secretary at the Company’s principal executive offices. Pursuant to the Company’s bylaws, stockholders who intend to present an item for business at the next annual meeting (other than a proposal submitted for inclusion in the Company’s proxy materials)
, including stockholders who intend to solicit proxies in support of director nominees other than the Company's nominees pursuant to Rule 14a-19 under the 1934 Act, must provide notice to the Corporate Secretary no earlier than January
6, 20233, 2025 and no later than February
5, 2023.2, 2025. Notice of stockholder proposals must contain the information required by the Company’s bylaws. The inclusion of any such proposal in such proxy material shall be subject to the requirements of the proxy rules adopted under the 1934 Act.
Management does not now intend to bring before the Annual Meeting any matters other than those disclosed in the Notice of Annual Meeting of Stockholders, and it does not know of any business that persons, other than management, intend to present at the
meeting.Annual Meeting. Should any other matters requiring a vote of the stockholders arise, the persons named in the accompanying proxy intend to vote on those matters in accordance with their best judgment.
The Company will bear the cost of soliciting proxies. In addition, to the extent necessary, proxies may be solicited by directors, officers and employees of the Company in person, by telephone or through other forms of communication, but such persons will not receive any additional compensation for such solicitation. The Company will reimburse brokerage firms, banks and other custodians, nominees and fiduciaries for reasonable expenses incurred by them in sending proxy materials to the beneficial owners of the Company’s shares. The Company will supply banks, brokers, dealers and other custodian nominees and fiduciaries with proxy materials to enable them to send a copy of such materials by mail to each beneficial owner of shares of the common stock that they hold of record and will, upon request, reimburse them for their reasonable expenses in so doing.
| | | | | | | | |
| |
By Order of the Board of Directors |
| 
| |
| |
Ernest W. Torain, Jr.
|
| | Executive Vice President, General Counsel
and Corporate Secretary |
Chicago, Illinois
March 25, 2022